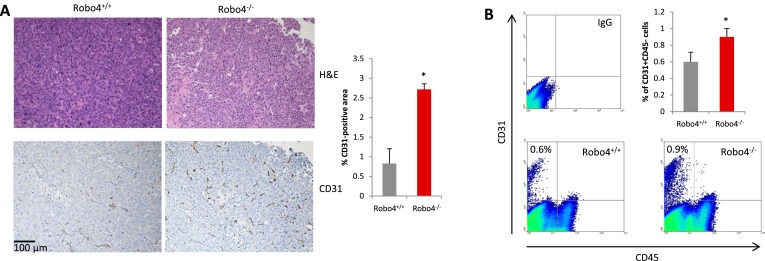
Figure 3.

Endothelial Robo4 knockout led to increased tumor angiogenesis. (A) Left: H&E staining and IHC staining of tumor blood vessels (CD31) in E0.2 tumors of Robo4+/+ and Robo4−/− mice. Right: Quantitative analysis of the CD31 staining areas (n = 3). (B) Flow cytometry analysis of relative numbers of tumor endothelial cells. Tumors from each group were digested into single‐cell suspensions using collagenase IV. Tumor endothelial cells (CD31+CD45−) were analyzed by flow cytometry. Statistical summary of 3 tumor samples from each group is shown in the bar graph of upper right panel. (*p < 0.05).
