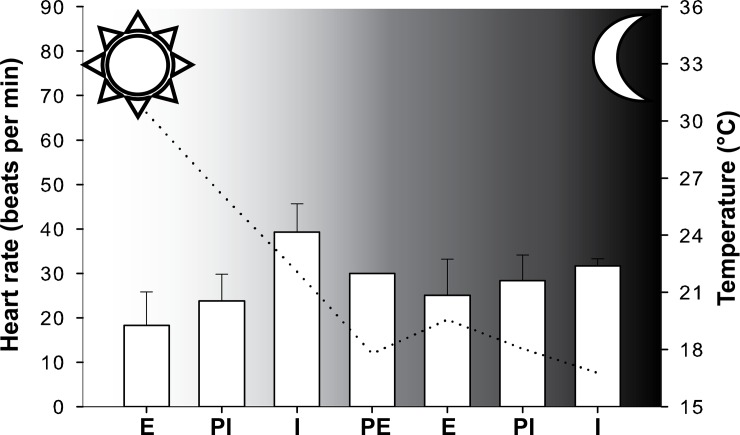
Fig 4. Heart rate variability during a complete tidal cycle measured for P. perna east individuals (average ± standard deviation, n = 2).
The dotted line shows the variation in the average temperature measured during the recording. The sun and moon symbols indicate the day and night periods. E, emersion; PE, partially emersed; I, immersion; PI, partially immersed.

