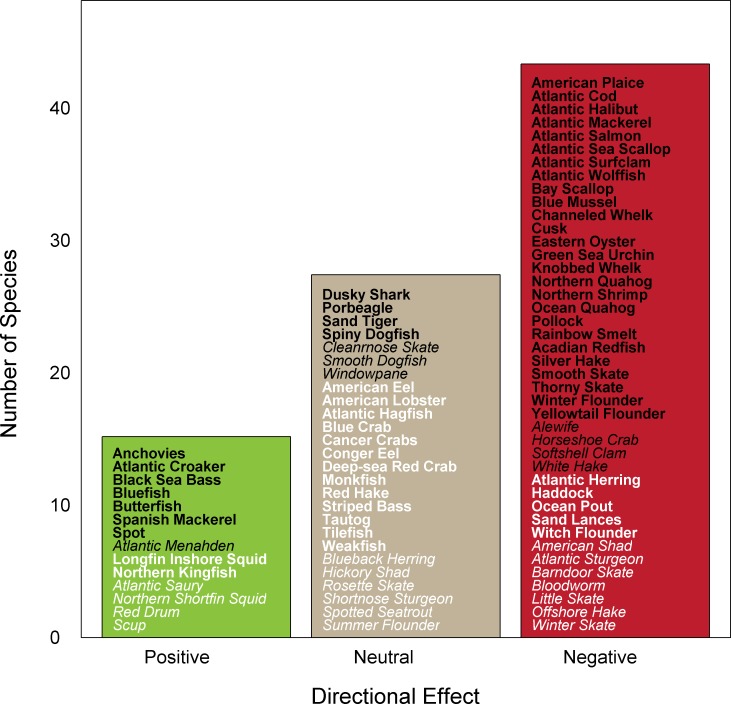
Fig 5. Directional effect of climate change.
Colors represent expected negative (red), neutral (tan), and positive (green) effects. Certainty in score is denoted by text font and text color: very high certainty (>95%, black, bold font), high certainty (90–95%, black, italic font), moderate certainty (66–90%, white or gray, bold font), low certainty (<66%, white or gray, italic font).

