
Figure 5.
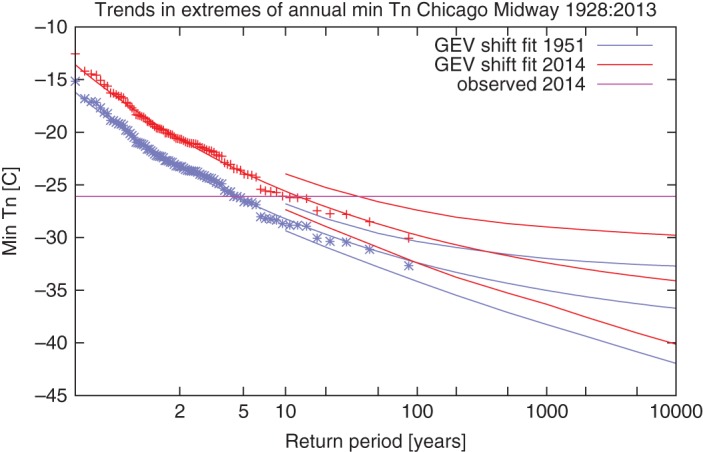
Generalized extreme value (GEV) distribution fit to the coldest temperature of the year at Chicago Midway station 1928–2013 compared to the value observed in 2014. The distribution of the temperature is assumed to shift with the smoothed global mean temperature. The red lines indicate the fit for the climate of 2014, the blue lines indicate the fit for an earlier climate. The observations have been drawn twice, once shifted up with the fitted trend to the current climate, once down to the climate of 1951.