Figure 3.
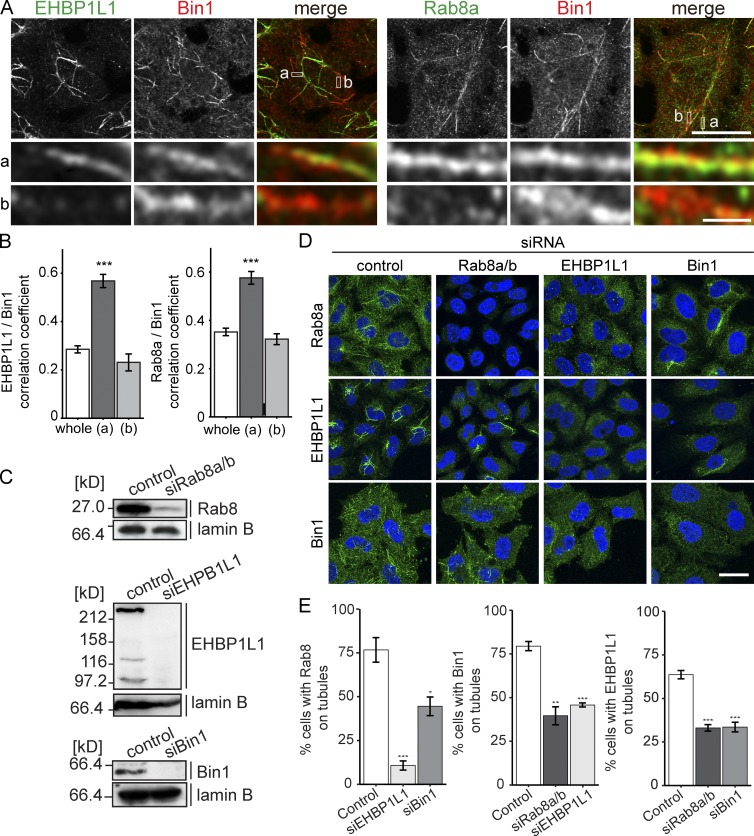
Rab8, EHBP1L1, and Bin1 stabilize each other on the tubules. (A) Immunofluorescence for EHBP1L1, Bin1, and Rab8a in HeLa cells. The enlarged views at the bottom show the overlap of the proteins on the tubular structures. Areas a and b are representative regions of the ERC depicting uniform intensity and heterogeneous intensity between the two proteins, respectively. Bars: (magnified views) 1 µm; (other views) 10 µm. (B) Correlation analysis comparing the distribution of EHBP1L1/Bin1 and Rab8/Bin1 in the whole cell (whole), the region positive for the two proteins (a), and the region positive for either protein (b). Data are mean ± SEM from at least 10 cells. ***, P < 0.001 relative to control; Student’s t test. (C) KD efficiency of Rab8, Bin1, and EHBP1L1 in HeLa cells. Lysates were analyzed by immunoblotting. Lamin B was used as a loading control. (D and E) HeLa cells transfected with siRNA for Rab8a and Rab8b, EHBP1L1, or Bin1 were stained with Rab8, Bin1, or EHBP1L1 antibody (green). Nuclei were indicated using DAPI (blue). Bar, 20 µm. (E) Quantification of the percentage of cells with tubular structures. Data are mean ± SEM from at least three independent experiments. *, P < 0.05; **, P < 0.01; ***, P < 0.001 relative to control; Student’s t test.

