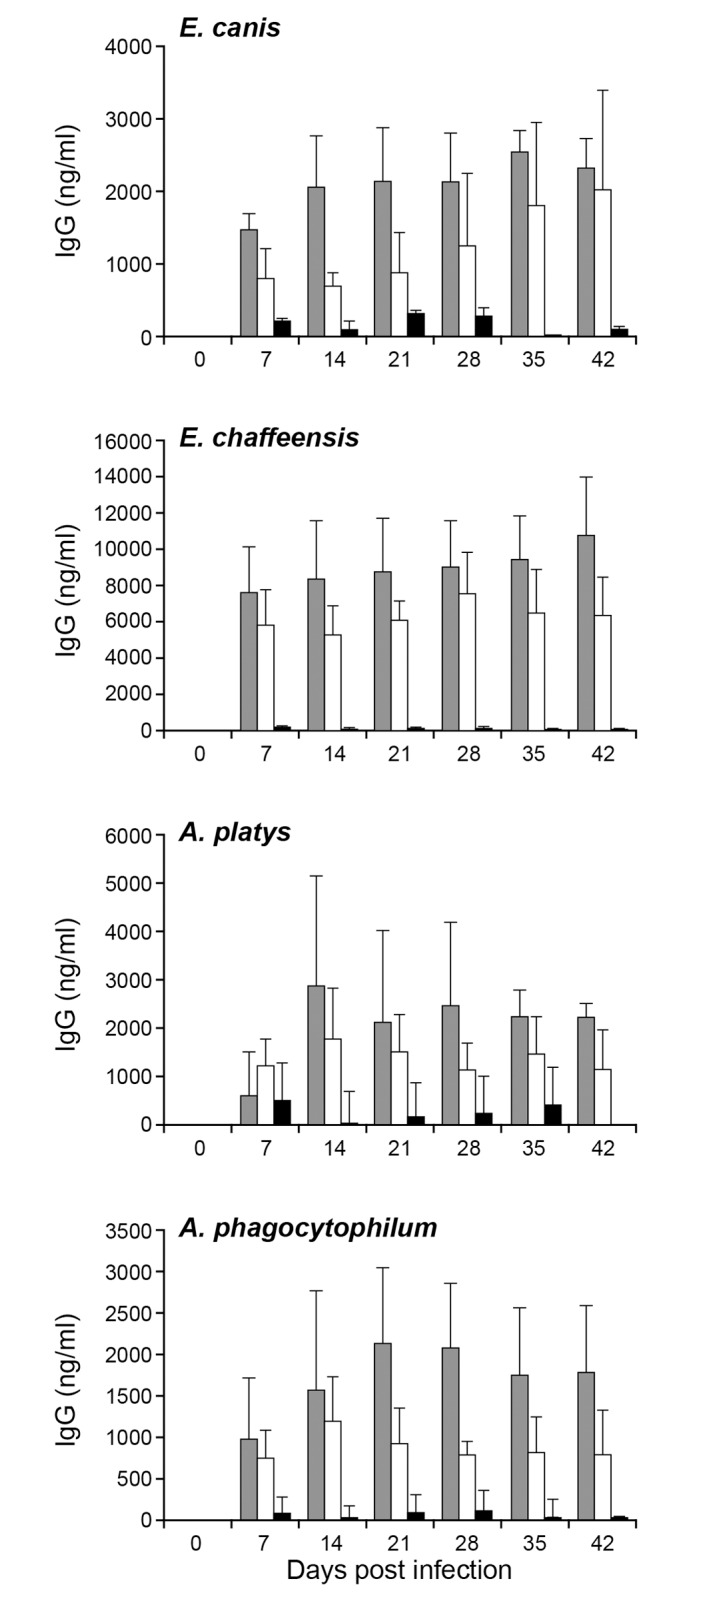
Fig 6. Total IgG and IgG subclass response in dogs following the pathogens’ infections.

Plasma samples were assessed to measure the concentrations of total IgG and IgG subclasses, IgG1 and IgG2 respectively. The quantity of each IgG was determined by comparing the absorbance observed for known quantities of positive controls. The values were presented as bars representing mean values ± SD. (Total IgG, gray bars; IgG1 black bars; IgG2 open bars).
