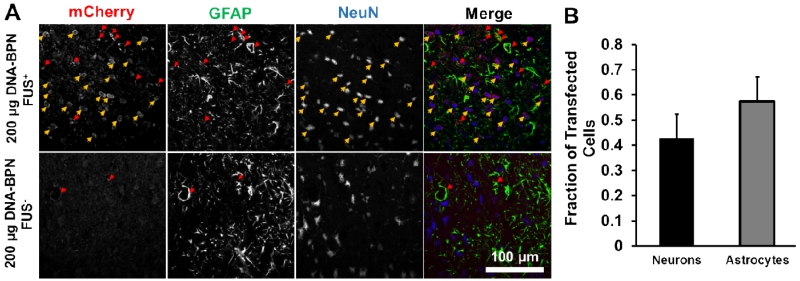
Figure 4.
DNA-BPN delivered across the BBB with FUS transfect both astrocytes and neurons. (A) Representative confocal fluorescent images show mCherry (red, left column), GFAP (green, middle-left column), NeuN (blue, middle-right column), and merge (right column) images 7 days after delivery of pBACH DNA-BPN with FUS (top row) or without FUS (bottom row). Arrows indicate colocalization of mCherry and GFAP (red) or NeuN (yellow). Scale bar = 100 μm. (B) Bar graph showing the relative fraction of mCherry+ cells that colocalize with the GFAP astrocytic marker or the NeuN neuronal marker. n = 6.

