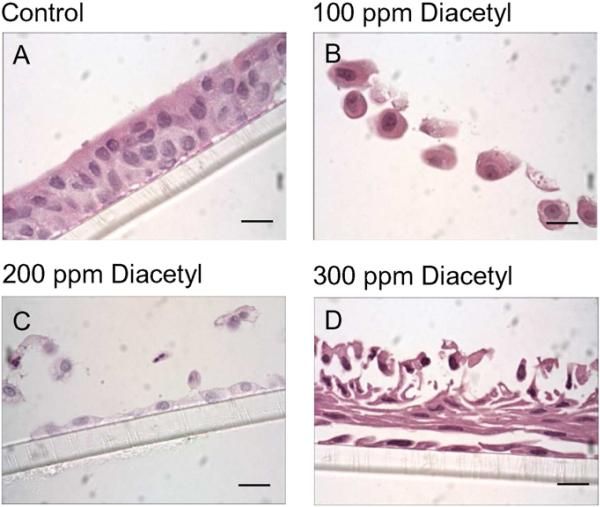
Fig. 9.
H&E images (objective magnification = 100×) illustrating the effects of diacetyl (100, 200, 300 ppm) on NHBE morphology. (A) Unexposed, control epithelial cells demonstrating the presence of a confluent, pseudo-stratified epithelium. (B) Cells exposed to diacetyl at 100 ppm, (C) 200 ppm and (D) 300 ppm. Bar = 10 μM.

