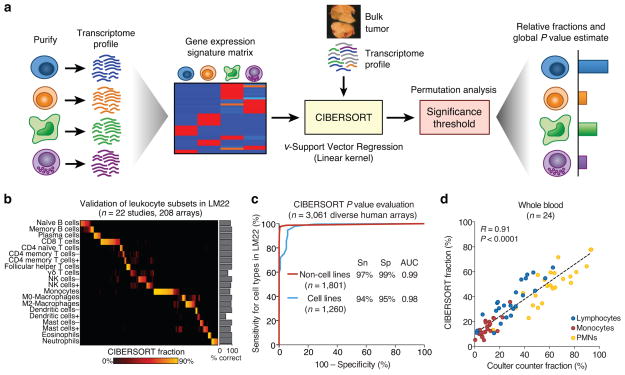
Figure 1.
Overview of CIBERSORT and application to leukocyte deconvolution. (a) Schematic of the approach. (b,c) Application of a leukocyte signature matrix (LM22) to deconvolution of (b) 208 arrays of distinct purified or enriched leukocyte subsets (Supplementary Table 2), and (c) 3,061 diverse human transcriptomes. Sensitivity (Sn) and specificity (Sp) in c are defined in relation to positive and negative groups (Online Methods). AUC, area under the curve. (d) CIBERSORT analysis of 24 whole blood samples for lymphocytes, monocytes, and neutrophils compared to measurements by Coulter counter12. Concordance was measured by Pearson correlation (R) and linear regression (dashed line). ‘CIBERSORT fraction’ in b denotes the relative fraction assigned to each leukocyte subset by CIBERSORT. Resting and activated subsets in b are indicated by + and −, respectively.

