Figure 2.
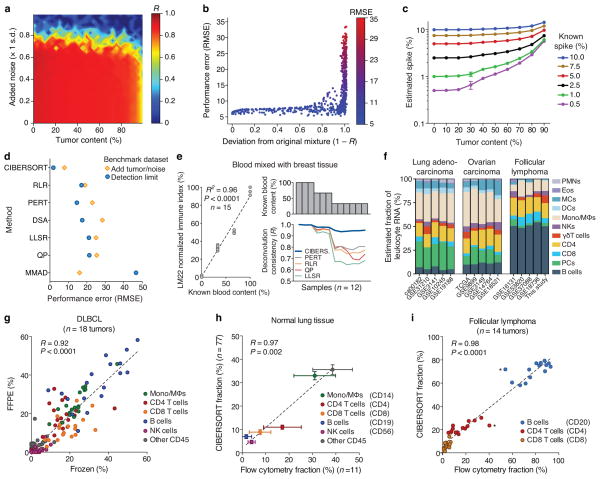
Performance assessment on RNA mixtures from complex tissues. (a–c) CIBERSORT accuracy for leukocyte subset resolution in simulated tissues, showing (a) performance across added tumor content (x-axis) and noise (y-axis), (b) deviation of mixtures in a from original values, and (c) detection limits of a given cell type as a function of increasing tumor content (n = 5 random mixtures for each data point). (d) Comparison of six GEP deconvolution methods with CIBERSORT for the analyses shown in a–c (Supplementary Figs. 5,6). (e) Analysis of whole blood spiked into breast tissue. Left: Reported blood proportions versus immune-related gene expression (LM22 normalized immune index; Online Methods). Right: Stability of leukocyte deconvolution across methods. (f) CIBERSORT consistency across independent studies within and across cancer types (for leukocyte abbreviations, see Supplementary Table 1). (g–i) CIBERSORT performance compared between (g) 18 paired frozen and FFPE DLBCL samples, and compared to flow cytometry analysis of (h) 11 normal lung tissues and (i) 14 follicular lymphoma tumors. Asterisks in i indicate potential outliers from the same patient. Surface markers used for quantitation in h and i are indicated in parentheses. Results in e–i were obtained using LM22 and then collapsed into 11 major leukocyte types before analysis (Supplementary Table 1). Concordance was determined by Pearson correlation (R) and linear regression (dashed lines) in e and g–i. Values in c and h are presented as medians ± 95% confidence intervals.

