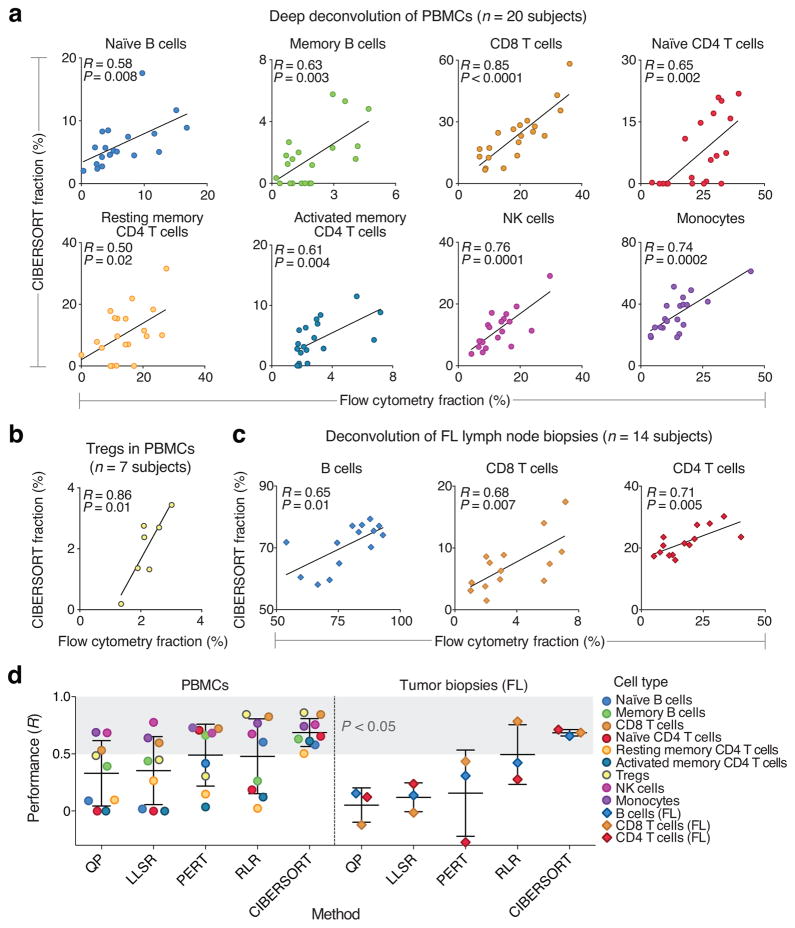
Figure 3.
Deep deconvolution and enumeration of individual cell subsets in 41 human subjects. (a–c) Direct comparison between CIBERSORT and flow cytometry for: (a) the indicated eight immune cell subsets in PBMCs from 20 subjects, (b) FOXP3+ Tregs in PBMCs from seven subjects, and (c) the indicated three immune cell subsets in lymph node biopsies from 14 subjects with follicular lymphoma (FL). Concordance was determined by Pearson correlation (R) and linear regression (solid lines). (d) Comparison of five expression-based deconvolution methods on the datasets analyzed in a–c. The shaded gray area denotes deconvolved cell types that significantly correlated with flow cytometry (P < 0.05, Pearson correlation). Scatterplots and RMSE values for all methods are provided in the supplement (Supplementary Figs. 12, 13 and Supplementary Table 4, respectively). In three instances, correlation coefficients could not be determined; these were assigned a value of zero for inclusion in this panel (Supplementary Table 4, Supplementary Fig. 12). Data are presented as means ± standard deviations.

