
Fig. 3.
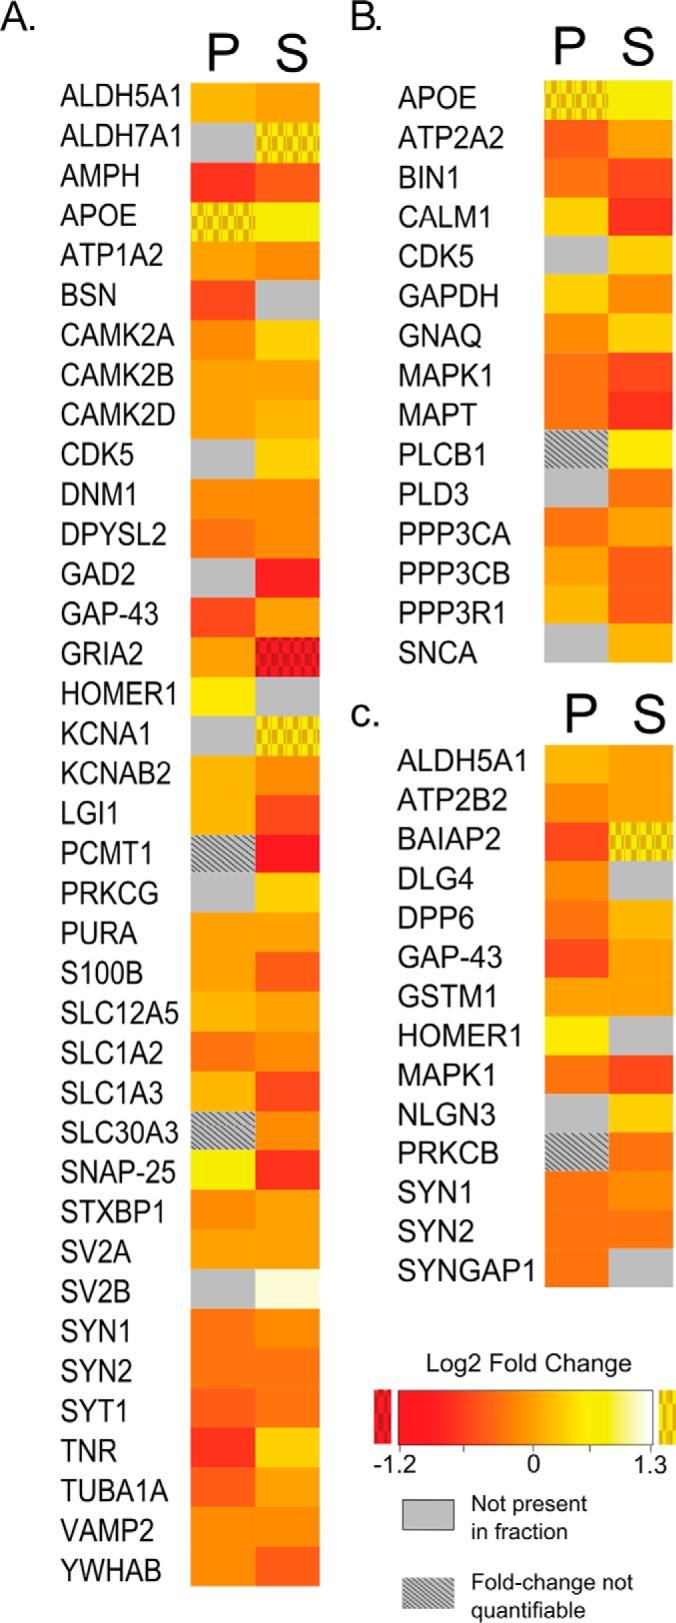
mTORC1 inhibition swiftly alters the expression of epilepsy, Alzheimer's disease (AD), and autism spectrum disorder (ASD) proteomes in a region-specific fashion. Epilepsy genes were obtained from the CarpeDB epilepsy gene database. AD genes were obtained from the AlzGene (top 10 list) and the KEGG Pathway Database for AD (KEGG hsa05010). ASD genes were obtained from the Simons Foundation Autism Research Initiative (supplemental Table S7–S8). Using these databases heatmaps were generated to represent protein expression in our PSD (P) and soluble (S) fractions following mTORC1 inhibition. For heatmaps, textured icons indicate out-of-range proteins with fold-changes of 0/Control (red textured) or RAPA/0 (yellow textured). Gray indicates that the protein was not detected in the fraction. Textured gray indicates that the fold-change was not quantifiable because only one of the three biological replicates for that treatment condition produced a nonzero spectral count value. A, Heatmap showing the log2 fold-change for the epilepsy proteins. B, Heatmap showing the log2 fold-change for the AD proteins. C, Heatmap showing the log2 fold-change for the ASD proteins.