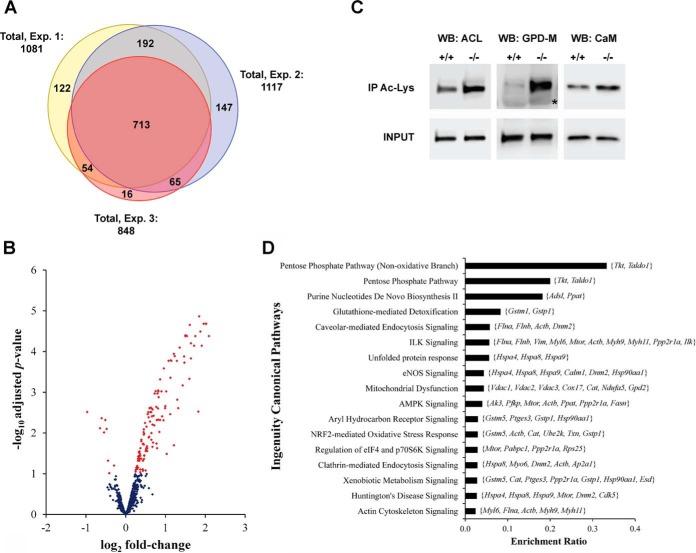
Fig. 3.
Changes in protein lysine-acetylation induced by chronic decreased glutathione levels in astrocytes. (A) Venn diagram showing the overlap of the acetylated sites quantified in the three independent experiments (Exp. 1–3). Exp. 2 corresponds to the experiment in which the SILAC label swap was introduced. (B) Volcano plot of the acetylation sites quantified in at least two independent experiments. Regulated sites in GCLM(−/−) astrocytes, as determined using moderated t test with a Benjamini–Hochberg corrected p value ≤ .1, are shown in red. (C) Representative images confirming regulated lysine acetylation by immunoprecipitation and Western blot analysis. Lysine-acetylated proteins were immunoprecipitated from protein extracts obtained from three independent GCLM(+/+) and GCLM(−/−) astrocyte cultures and then analyzed by Western blot analysis using antibodies against ATP-citrate synthase (WB: ACL); glycerol-3-phosphate dehydrogenase (mitochondrial) (WB: GPD-M); and calmodulin (WB: CaM). Membranes were stripped for reprobing with the different antibodies. 20 μg of whole protein extracts were analyzed in the same gel as input control (INPUT). The asterisk corresponds to the heavy chain of the IgG used for immunoprecipitation. (D) Major ingenuity canonical pathways overrepresented by proteins with regulated acetylation sites in GCLM(−/−) astrocytes. Members of each pathway that were present in the dataset of regulated sites are indicated on the graph (gene symbol). Significance was established at BH adjusted p ≤ .05.

