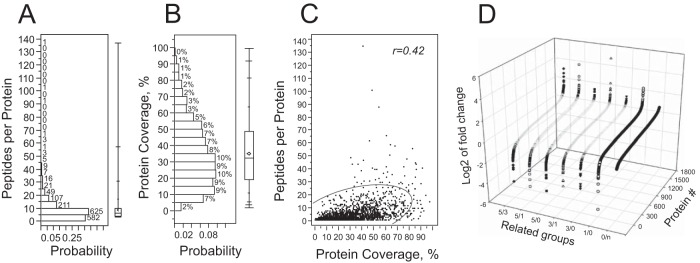
Fig. 2.
Statistical characteristics of data preprocessing used for protein quantitation. A, Histogram of peptides per protein distribution profile. Numbers above the histogram bars denote counts per bin. B, Distribution of sequence coverage of proteins reproduced from at least three peptides. Numbers above the histogram bars denote counts per bin. C, Scattered plot of all point correlation between Sequence coverage and peptides per proteins values. The “r” denotes correlation coefficient. Semieliptic line shows 95% confidence interval. D, Protein expression mean values distribution profile per each tested group averaged over all biological replicates. Protein # is unique for each expression profile in each group.

