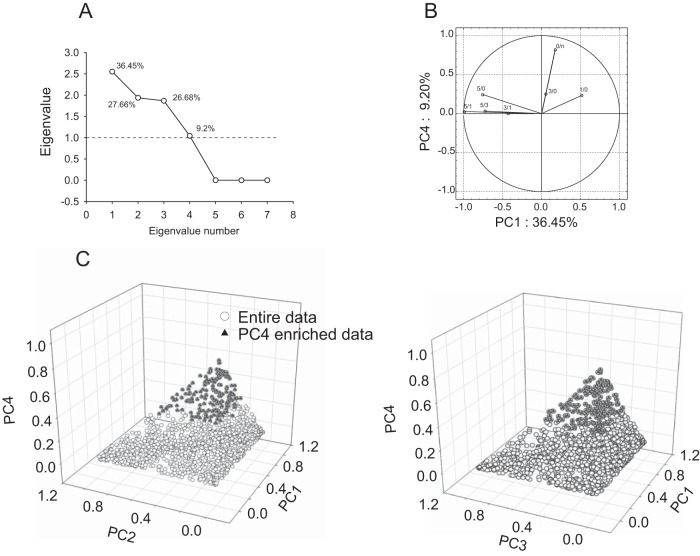
Fig. 3.
Removal RAM paradigm nonrelated proteins using Principal component analysis (PCA). A, Scree plot depicting eigenvalues distribution of PCA applied to variables representing protein expression ratio of all time point ratio groups averaged over three biological replicates. Percentage numbers above each eigenvalue coordinate depict data variance accounted for by that eigenvalue, hence being correlating with a specific factor. B, Scattered plot representing correlation between the variables and principal components, PC1 and PC4. Graph displays significant correlation between 0/n and PC4. C, Scattered plot of factor score coordinates of individual proteins on four dimensional space (four PCs) represented in two 3D plot. Extraction of PC4 correlating proteins (solid triangles) using squared cosine extraction method.

