Fig. 6.
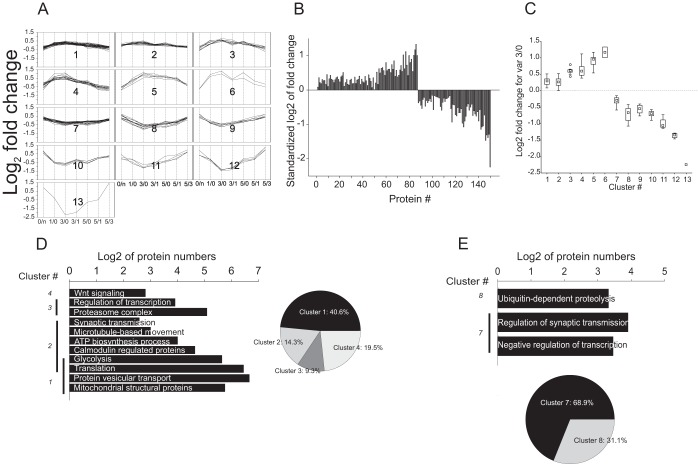
Quantitative and functional characterization of proteins correlating with factor 2. A–C, As in Fig. 5A–C. D, GO annotation and KEGG and BioCarta signaling pathway database based functional clustering of proteins agglomerated in hierarchic cluster of data positively correlating with factor 2. E, As in D for negatively correlating proteins.

