
Fig. 2.
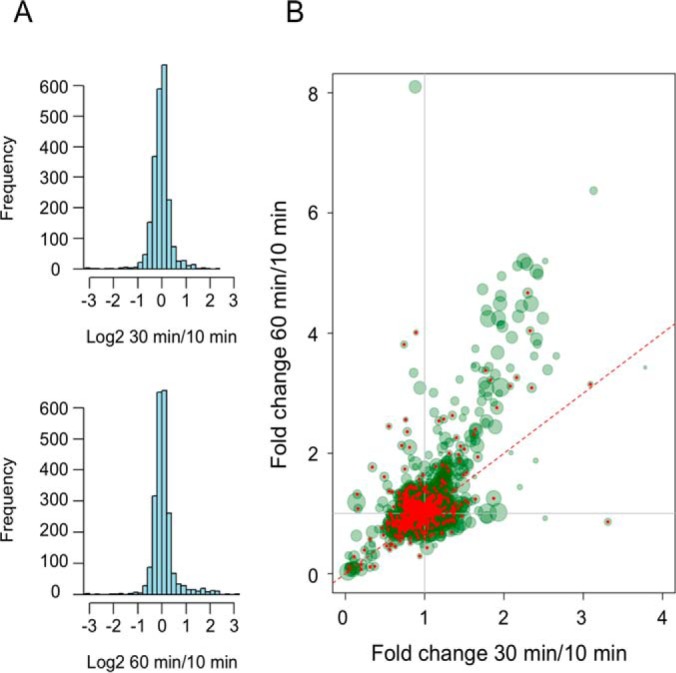
SILAC analysis. A, Normal distribution of the log2 ratios of 30 min/10 min proteome (top) and 60 min/10 min proteome (bottom). B, SILAC fold change (FC) scatter plot. X-axis (M/L: 30 min/10 min). Y-axis (H/L: 60 min/10 min). Proteins associated with high intensities as determined by the MaxQuant/Andromeda software are plotted with larger point sizes. Proteins on the red dotted line are characterized by identical M and H values. Potential nonspecific proteins are in red.