Fig. 2.
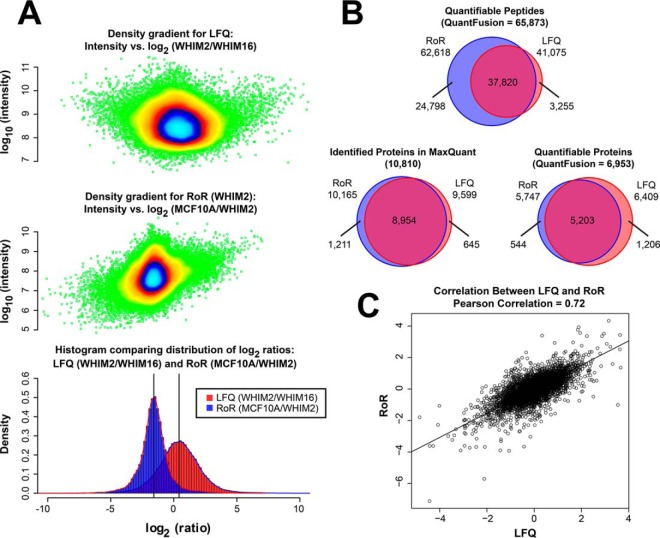
Comparison of LFQ and RoR methods. A, histograms of the LFQ measurements between the PDX tumors (red) and ratio measurements via the added-in heavy-labeled cell lines to obtain RoR (blue). The LFQ ratios of peptides between WHIM2 and WHIM16 are median-centered on zero fold-change, although the RoR distributions of peptides between each WHIM and MCF10A (results shown only for MCF10A/WHIM2) are medians centered at 1.58 (3-fold). Note that all the data points in each distribution are shown as density gradient plots above each distribution. B, Venn diagrams showing the number of quantifications obtained for LFQ, RoR, and QuantFusion methods for global peptides and global protein groups. With QuantFusion, the number of quantifiable peptides is 65,873, and the number of quantifiable protein groups is 6,953. A Venn diagram showing the number of protein groups identified in the initial MaxQuant search is also displayed. C, scatter plot showing the correlation between LFQ- and RoR-derived estimates for WHIM2/WHIM16 ratios.

