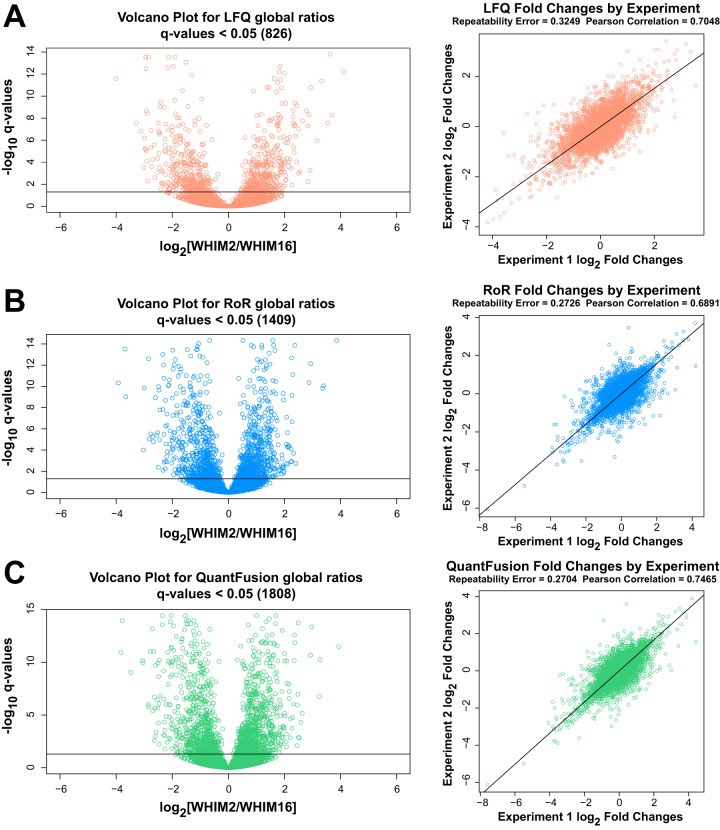
Fig. 4.
Volcano plots and corresponding repeatability plot. The volcano plot shows −log10 of q-value that each protein fold-change is ≤0.05 plotted against the log2 fold-changes. Here, we consider multiple ways to analyze the same data. On the left, we have the results from measuring both replicates together with each of three methods. On the right, we are splitting up the data and analyzing each replicate separately. This enables us to measure the repeatability error for each method. Repeatability error is used to measure the experimental precision obtained with each method. This error was computed by taking the within-protein variance (across experiments) and then computing the average of these variances. The Pearson correlation coefficient is the retest correlation that provides a measure of how well the ranking of protein estimates is preserved across experiments. A, LFQ analysis. B, RoR analysis. C, QuantFusion analysis. Note that our results demonstrate that the QuantFusion method provides both the best retest correlation and the best precision. Note that the RoR method has the least variability, which suggests that the advantages gained from the extra data used in the QuantFusion method outweigh the disadvantage of incorporating into the model the noisier LFQ data.

