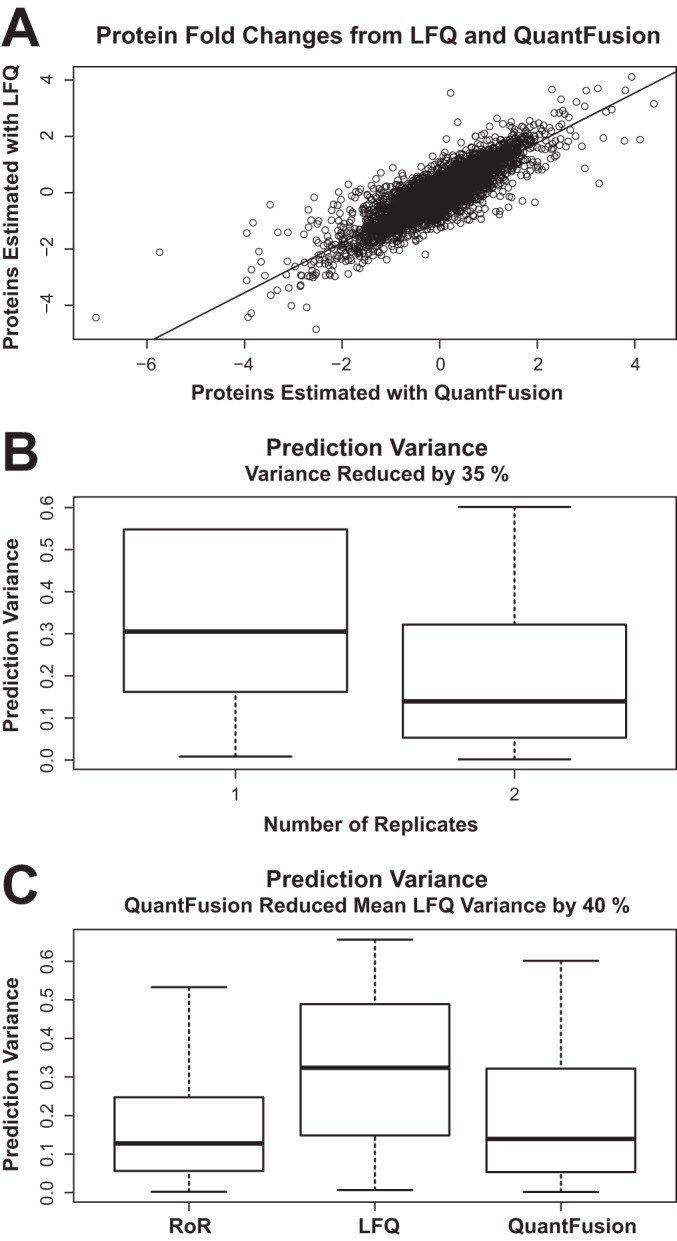
Fig. 5.

Comparing protein estimates and prediction of variances. A, scatter plot of log2 fold-change estimates using QuantFusion (x axis) and LFQ (y axis), with data from both replicates combined. The fold-change estimates are very similar between methods with a Pearson correlation coefficient of 0.82. B, estimates of prediction variances of the log2 fold-changes obtained by using only LFQ results with one replicate are compared with the variance estimates from performing LFQ with two replicates. Adding a full experimental replicate reduces the average variance by 35%. C, boxplots of the prediction variances for each method. Label-free fold-change estimates exhibit the highest variability. Using QuantFusion to combine the noisier LFQ data with the more precise RoR data results in a 40% reduction of average variability.
