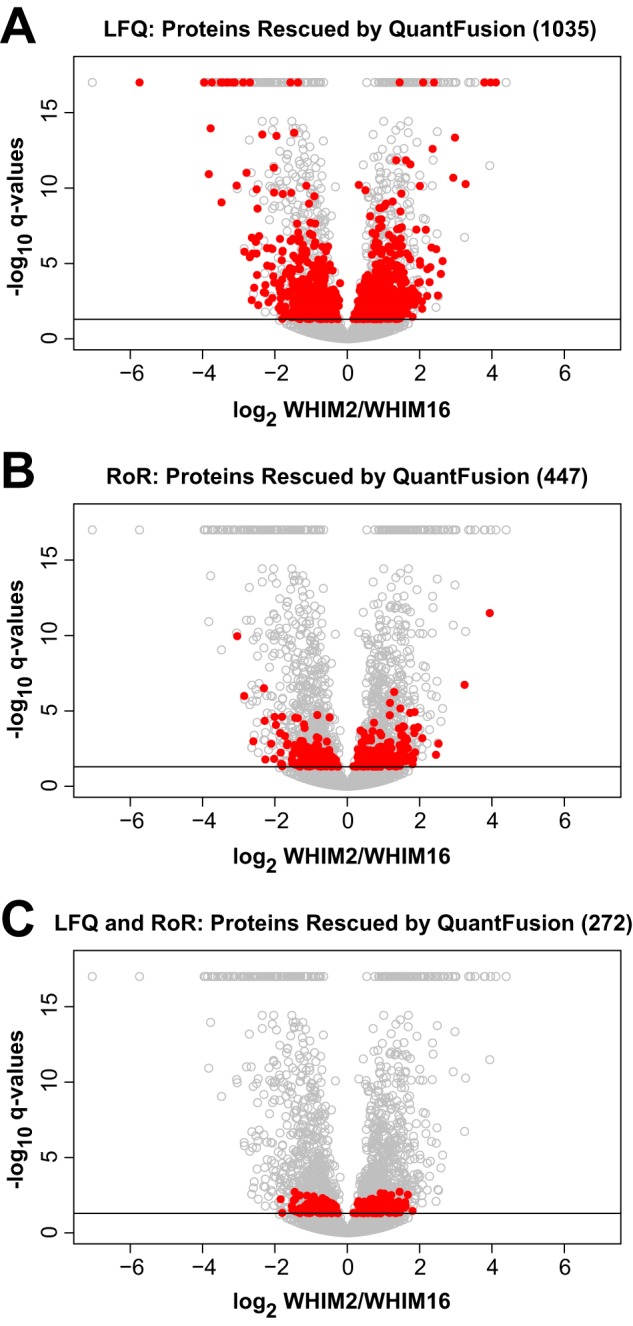
Fig. 6.

Volcano plots indicating significantly differentially expressed proteins rescued by QuantFusion. Similar to Fig. 4C, the volcano plots show −log10 of q-value plotted against the log2 WHIM2/WHIM16 fold-changes for each protein in the QuantFusion analysis. Significantly differentially expressed proteins are shown above the cutoff q-value (−log10(0.05) equals about 1.3). Proteins rescued by QuantFusion are indicated as red circles for not significantly differentially expressed (or not quantifiable or not identified) in LFQ (A), in RoR (B), and in both LFQ and RoR (C). Proteins with a q-value of 0 are plotted as a group at the top of each plot.
