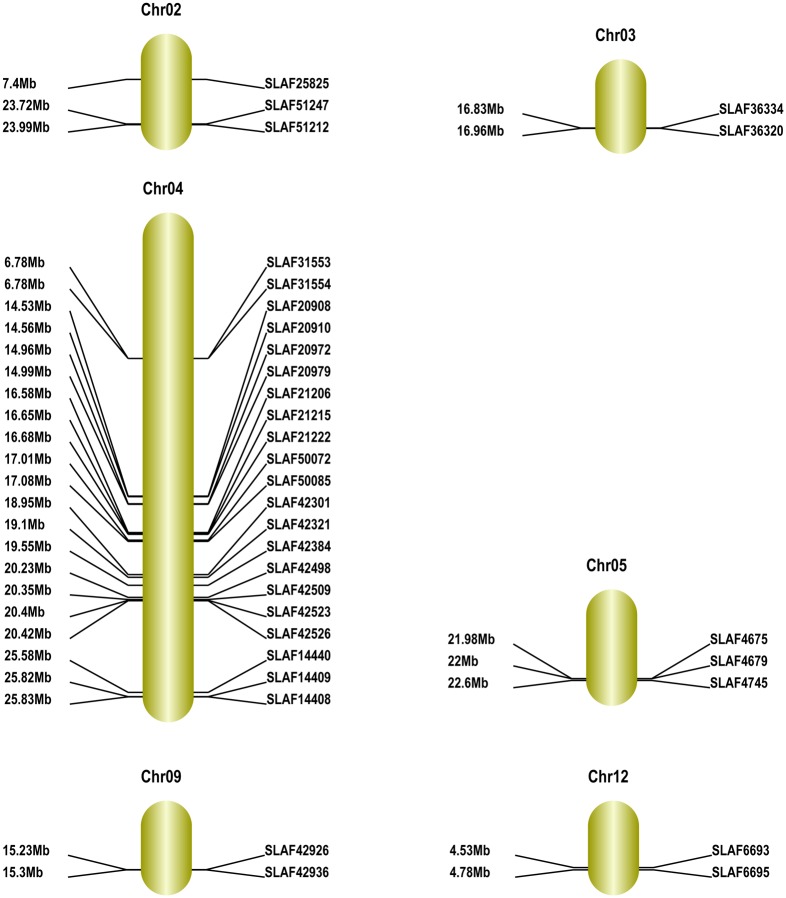
Fig 11. Maps of sour trait-related genomic regions in melon obtained using the GenticMapDrawer.pl l software.
Chromosome numbers are according to Garcia-Mas et al. [18]. Distances from the top of each chromosome are marked on the left side, and marker names are on the right side of each linkage group.

