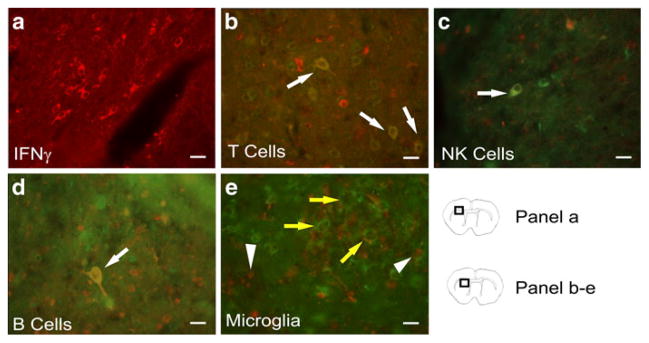
Fig. 3.
Representative brain sections from rats 96 h post-MCAO were stained with IFNγ and immune cell surface markers to identify what types of cells are expressing IFNγ in the infarct and peri-infarct. Micrographs show IFNγ (red) (a), and double staining merged images of IFNγ (red) with CD3 (green) for T cells (b), CD161 (green) for natural killer cells (c), and CD45R (green) for B cells (d); yellow cells with white arrows indicate areas of co-localization. A micrograph of staining with CD11b (green) for microglia/macrophages and IFNγ (red) (e) demonstrate a lack of co-localization of CD11b and IFNγ. In figure e, arrow heads indicate IFNγ positive cells and yellow arrows indicate CD11b positive cells. Scale bars=20 μm. Box in brain graphics depicts the regions where images were taken for a given micrograph

