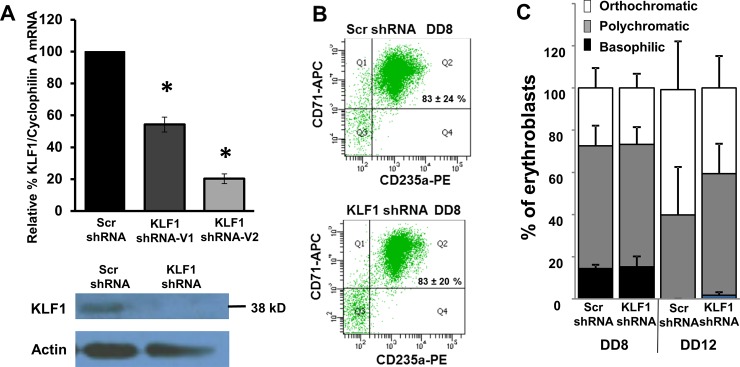
Fig 2. Scr and KLF1 shRNA-treated UCB erythroblasts have similar erythroid differentiation profiles on differentiation day 8 (DD8).
(A) Efficiency of KLF1 knockdown. Top panel: KLF1 mRNA amount was measured in scramble (Scr) and KLF1 shRNA-treated cells by qRT-PCR. The amount of KLF1 mRNA in scramble-treated cells was set to 100 for each sample. Cyclophilin A mRNA was used as the internal standard for qRT-PCR. N = 19 for Scr shRNA, N = 3 for KLF1 shRNA-V1 and N = 16 for KLF1 shRNA-V2; error bars = standard error, * = p-value<0.001. Bottom panel: Representative Western blot analysis in Scr and KLF1 shRNA treated UCB erythroblasts. Actin was used as a loading control. For this sample, residual KLF1 mRNA = 13% and residual KLF1 protein = 42%. (B) KLF1 knockdown does not adversely affect erythroid differentiation. Representative flow cytometry plots indicate that the majority of erythroid cells are double positive for CD71 and CD235a in both scramble shRNA-infected and KLF1 shRNA-V2-infected cells on DD8. N = 3. Student’s t-test showed no significant difference in the number of double positive cells between Scr and KLF1 shRNA-treatment groups. Residual KLF1 mRNA = 13–25%. (C) KLF1 knockdown does not affect erythroid maturation. At day 8 and at day 12 of differentiation, cytospin slides of Scr or KLF1 shRNA treated cells were prepared, and erythroid maturation was scored blind to treatment group. 100 cells from each slide were scored based on their morphology and designated as basophilic, polychromatic or orthochromatic erythroblasts. N = 5, error bars = standard error. Student’s t-test showed no significant differences in the number of erythroblasts of each type between Scr and KLF1 shRNA treatment groups. Residual KLF1 mRNA = 6–24%.

