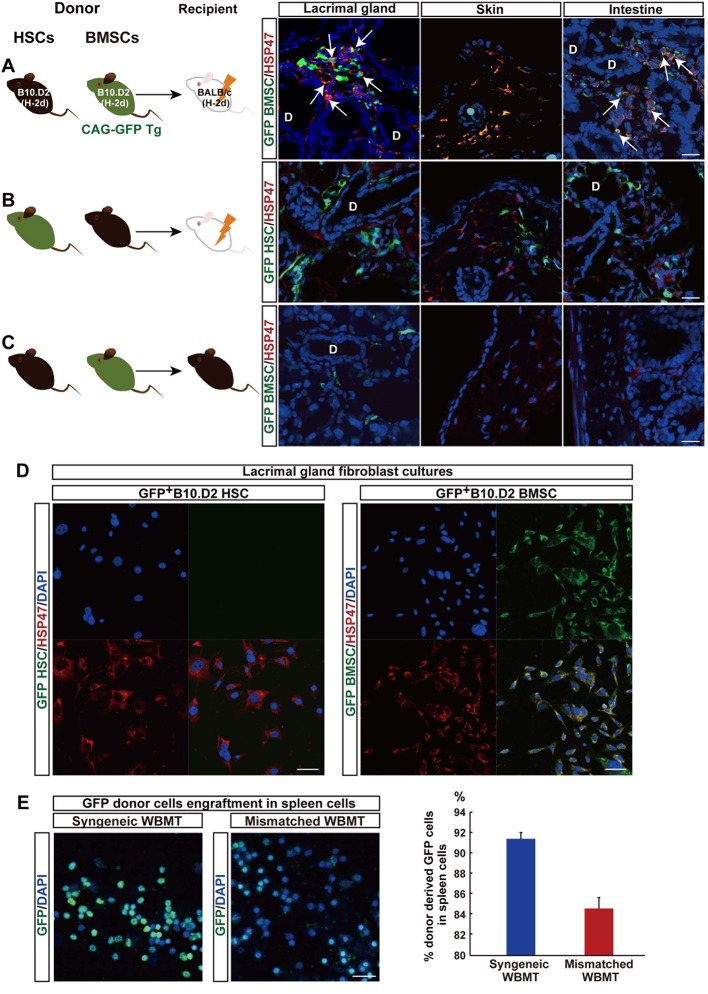
Figure 2. Mismatched donor derived-fibroblasts engrafted in target tissues of fibrosis.
(A, B) Transplantation scheme of EGFP+-labeled B10.D2 PαS-BMSCs (A) or SP-HSCs (B). Each was co-transplanted into wild-type BALB/c mice along with unlabeled SP-HSCs (A) or PαS-BMSCs (B), respectively. Arrows indicate colocalized cells in yellow (GFP-labeled BMSCs expressed HSP47) in the lacrimal gland and intestine. (C) Syngeneic wild-type B10.D2 SP-HSCs and EGFP+-labeled B10.D2 PαS-BMSC co-transplantation into wild B10.D2 mice. HSP47+ (red) fibroblasts observed in mismatched BALB/c recipients were BMSC-derived, and not HSC cells. Nuclei were counter stained with DAPI (blue). The data in Figure 2A–C from two replicate experiments (n = 3 per group). Scale bar, 20 μm. (A–C) D, duct. (D) Cultured HSP47+ lacrimal gland fibroblasts after mismatched EGFP+ HSC transplantation were EGFP- (left), while the majority of fibroblasts after mismatched EGFP+ BMSC transplantation were EGFP+ fibroblasts (right, positive cells in yellow) indicating the donor BMSC origin of fibroblasts. (E) Donor–derived EGFP+ cells were observed in the spleen 3 weeks after syngeneic EGFP+ WBMT (left), while engraftment of donor cells were sparse following mismatched WBMT (right), indicating a number of residual host cells remained after mismatched WBMT. Figure 2D,E from representative data of two replicate experiments (n = 2 or 3 per group). Scale bar, D = 50 μm, E = 20 μm. BMSC, bone marrow stromal/stem cells; HSP, heat-shock protein; HSCs, hematopoietic stem cells
DOI: http://dx.doi.org/10.7554/eLife.09394.013


