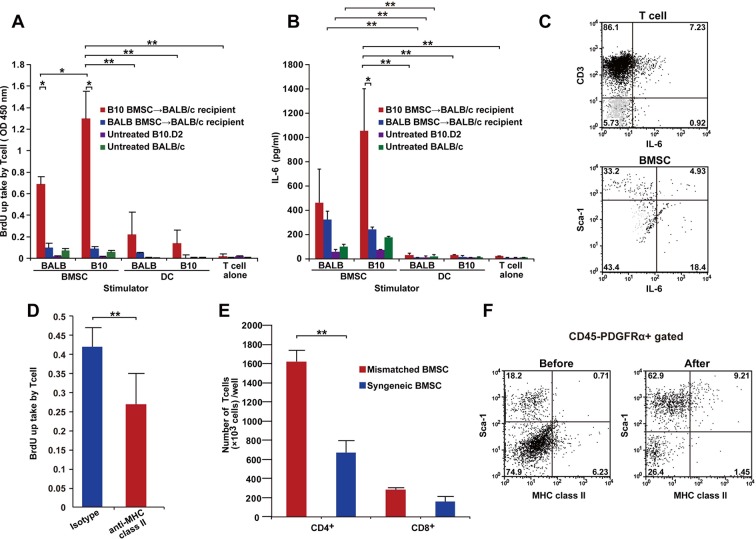
Figure 6. T cells following mismatched BMT are activated by PαS-BMSCs.
(A, B) T cells isolated from mismatched BMSC-transplanted recipients proliferated when co-cultured with donor BMSCs (A), which was significantly blocked by anti-MHC class II antibody treatment (D). (B) Increased IL-6 production was observed following co-culture of T cells from mismatched BMSC-transplanted recipients with donor PαS-BMSCs, but not with splenic dendritic cells (DCs). Color bars indicate source of T cells. Results are from triplicate cultures of two independent experiments in both (A) and (B) and from quintupulicate of two independent experiments in (D). Data are shown as mean ± SD. *p<0.05, **p<0.01. (C) Both CD3+ T cells and Sca-1+ BMSCs produced IL-6 following co-culture described in (A). Dot plots of mismatched BMSCs-transplanted recipient samples are shown in black, and isotype control in light grey. (E) The increase in T cell proliferation under co-culture with mismatched BMSCs (red) was due to the activation of CD4+ and not CD8+ T cells. Data collected from triplicate cultures of two replicate experiments (n = 2 per group). Data are shown as mean ± SD. **p<0.01. (F) MHC class II expression was upregulated in BMSCs after co-culture with T cells from mismatched BMSC-transplanted recipients. BMT, bone marrow transplantation; BMSC, bone marrow stromal/stem cells; SD, standard deviation.
DOI: http://dx.doi.org/10.7554/eLife.09394.024

