. 2016 Jan 26;5:e12034. doi: 10.7554/eLife.12034

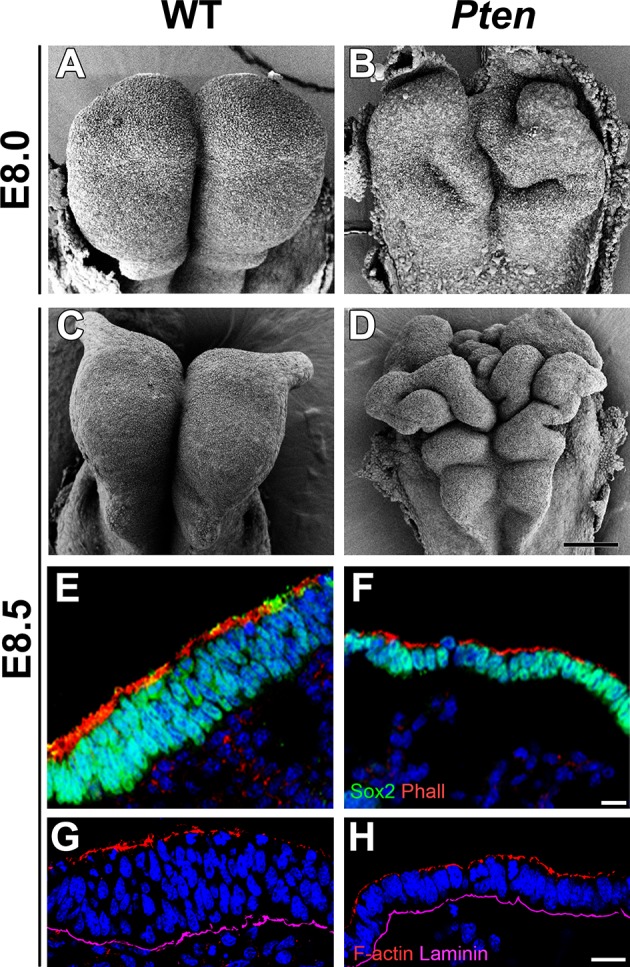
Figure 1. Morphological defects in the Pten mutant cephalic neural plate.

(A, B, C, D) Comparison of neural plate morphology of the dorsal head of wild-type (WT) and Pten △Epi mutant embryos at E8.0 and E8.5 in scanning electron microscope images. Scale bar = 100 μm. (E, F) Transverse sections of E8.5 WT and Pten △Epi embryos show the absence of pseudostratified columnar organization in the Pten mutant cephalic neural plate. Green is SOX2, red is phalloidin (F-actin), blue is DAPI. (G, H) Z-stack projection of three optical sections (total of 3 µm) from transverse sections of the cephalic neural plate of E8.5 WT and Pten △Epi mutant embryos stained for phalloidin (red) and laminin (purple). Scale bar E–H = 10 μm.
DOI: http://dx.doi.org/10.7554/eLife.12034.003

Figure 1.

Figure 1—figure supplement 1. PTEN expression in the cephalic neural plate.
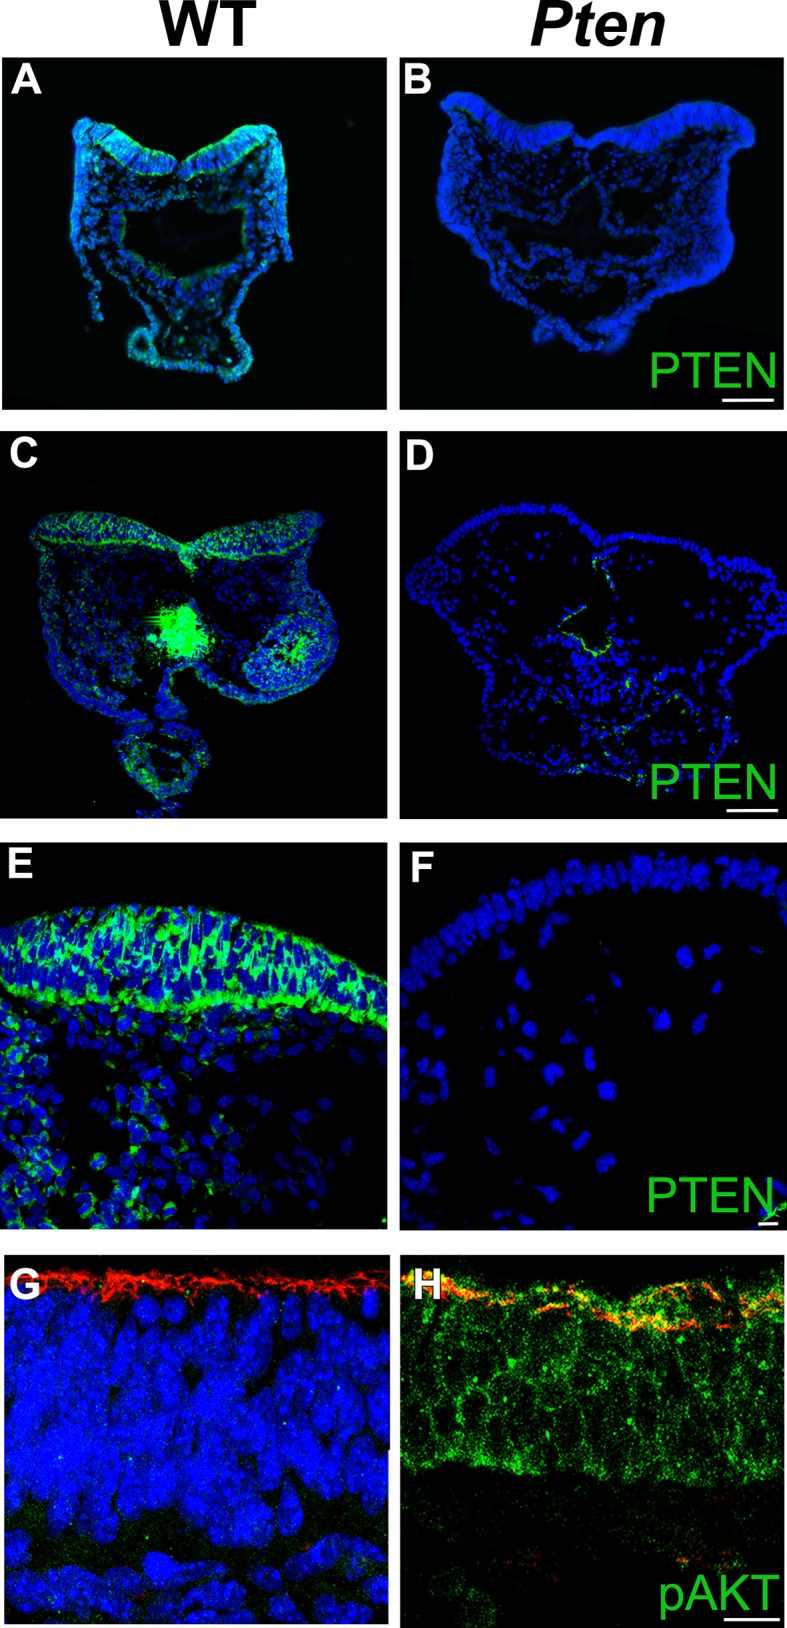
Figure 1—figure supplement 1.

Immunodetection of PTEN in transverse sections of E8.5 WT (A, C, E) and the Pten △Epi embryos (B, D, F) shows the specificity of PTEN staining. (A,B) Antibody from cell signaling; (C–F) antibody from cascade. (G, H) Z-stack projections of 3 optical sections taken every 1 μm, showing expression pAKT S473 expression in transverse sections of the E8.5 WT (G) and Pten △Epi (H) neural plate. Red is phalloidin and blue is DAPI. Scale bar in A–D = 100 μm; in E–H = 10 μm
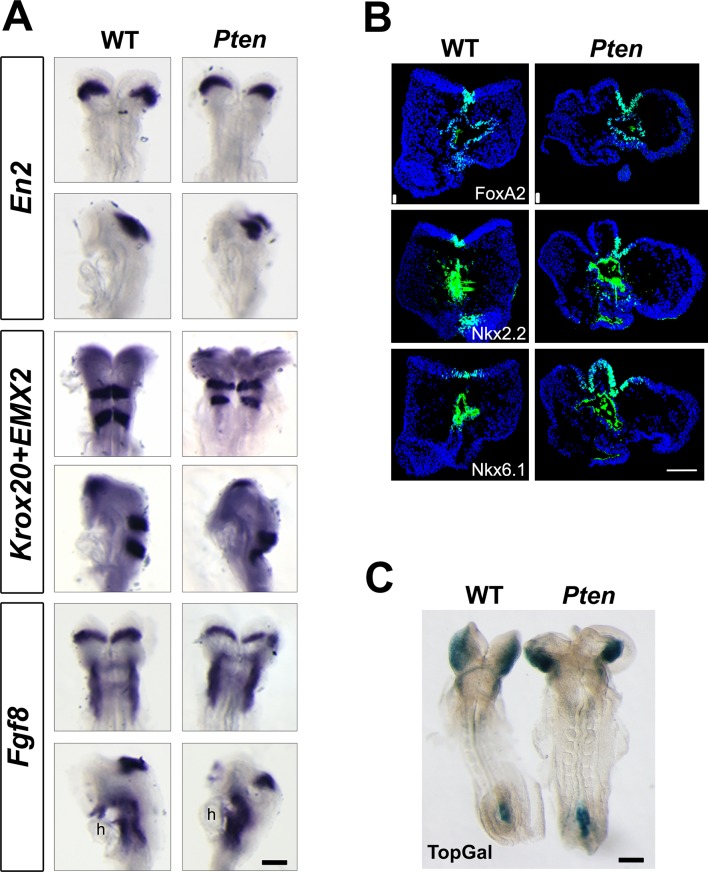
Figure 1—figure supplement 2. Normal neural patterning in PtenEpi embryos.

Figure 1—figure supplement 2.

(A) In situ hybridization for Engrailed2, Krox20, Emx2 and Fgf8 in WT and Pten △Epi embryos at E8.5 showed normal anteroposterior regionalization of cephalic neural epithelium. Scale bar = 180 μm. (B) Immunodetection of FoxA2, Nkx2.2 and Nkx6.1 shows normal dorsal-ventral patterning of the E8.5 cephalic neural plate in Pten △Epi embryos. Scale bar = 100 μm. (C) The TOPGAL reporter of canonical Wnt signaling was expressed in the normal domains and at normal levels in E8.5 Pten △Epi embryos. Scale bar = 180 μm.
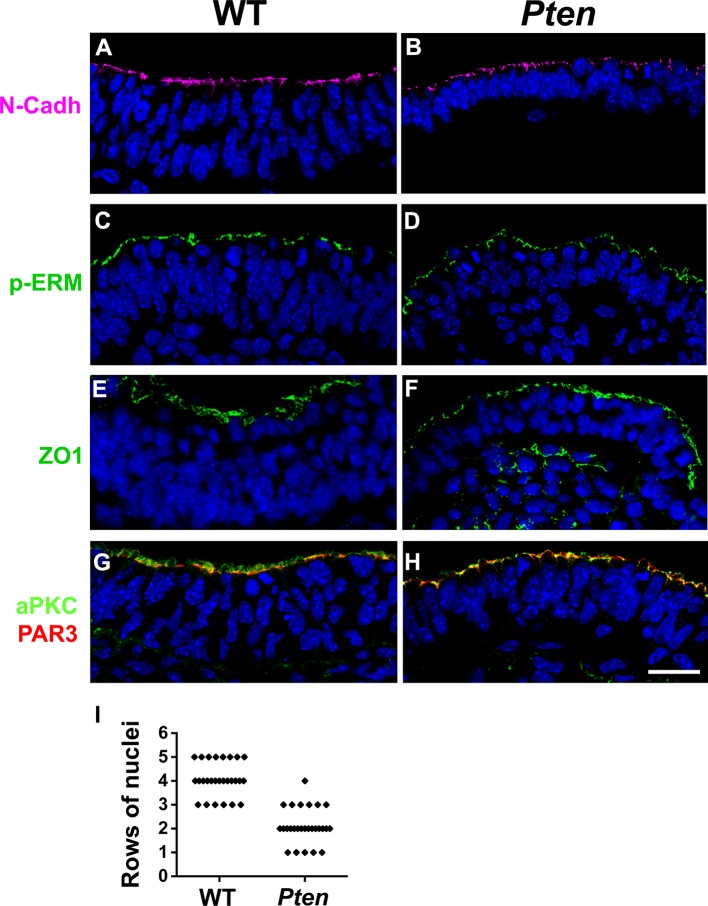
Figure 1—figure supplement 3. Apical markers in Pten △Epi mutant embryos.

Figure 1—figure supplement 3.

Z-stack projection of three optical sections (total of 3 µm) from transverse sections of the cephalic neural plate of E8.5 WT and Pten △Epi mutant embryos stained for (A, B) N-Cadherin, (C, D) pERM, (E, F) ZO1 and (G, H) aPKC (green) and PAR3 (red). (I) Comparison of the number of rows of nuclei in the pseudostratified cephalic neural plate of E8.5 wild-type and Pten △Epi embryos. n = 27 embryos for each genotype. Blue is DAPI. Scale bar = 20 µm.