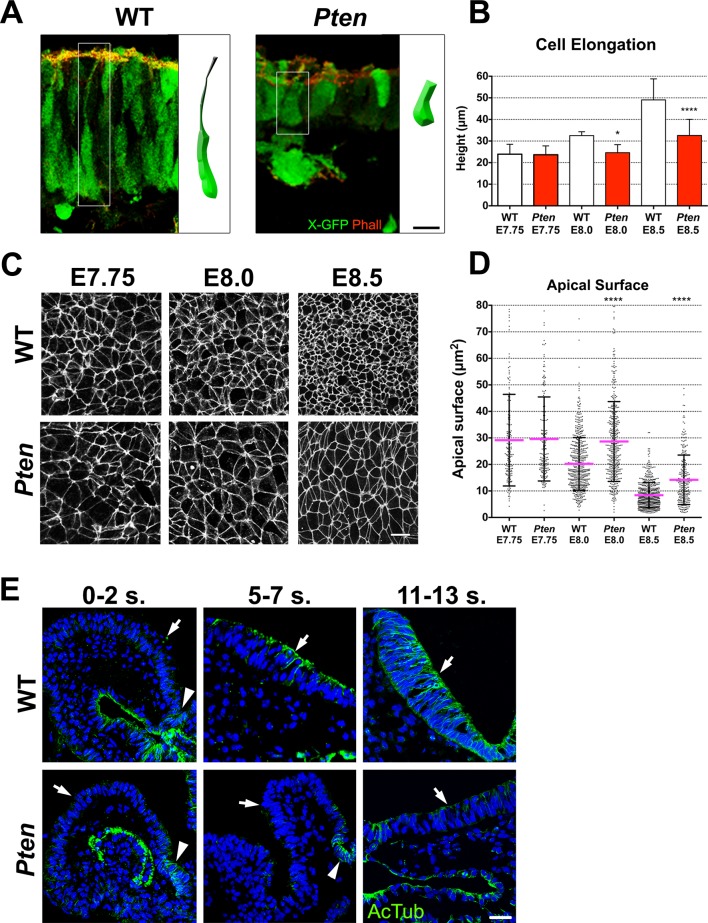
Figure 2. Cellular defects of Pten △Epi mutant neuroepithelial cells.
(A) Comparison of WT and mutant cell shape in the E8.5 cephalic neural plate, using X-linked GFP-expression to mark individual cells. Schematic representations of individual cells for each genotype are shown (white box). Red is phalloidin. Scale bar is 10 μm. (B) Comparison of neural plate height in the cephalic region of WT and mutants. WT E7.75 = 23.9 ± 4.5 μm; Pten △Epi E7.75 = 23.6 ± 4.1 μm: WT and mutant are not different, p = 0.86, by standard t-test. WT E8.0 = 32.5 ± 1.7 μm; Pten △Epi E8.0 = 24.6 ± 3.7 μm: WT is significantly taller than the mutant, *p = 0.0164. WT E8.5 = 49.1 ± 9.6 μm; Pten △Epi E8.5 = 32.6 ± 7.4 μm; WT is significantly taller than the mutant, ****p < 0.0001. For this and similar analyses below, >100 measurements were made from >3 embryos. (C) Comparison of apical cell shape in the cephalic neural epithelium of WT and Pten △Epi embryos viewed en face at E7.75, E8.0 and E8.5. Cell borders are marked by expression of ZO1 (white). Scale bar = 20 μm. (D) Apical surface of cephalic neural epithelial cells, taken from images like those shown in (C). WT E7.75 = 29 ± 17 μm2; Pten △Epi E7.75 = 30 ± 16 μm2: WT and mutant are not different, p = 0.79. WT E8.0 = 20 ± 10 μm2; Pten △Epi E8.0 = 29 ± 15 μm2. The WT surface area is significantly smaller than in the mutant, ****p < 0.0001. WT E8.5 = 8 ± 4 μm2; Pten △Epi E8.5 = 14 ± 9 μm2. The WT surface area is significantly smaller than in the mutant, ****p < 0.0001. (E) Acetylated microtubule arrays in the neural plate in stage-matched WT and mutant embryos. Transverse sections of cephalic regions of WT and Pten △Epi embryos at E8.0 (0– 2 somites), E8.5 (5–7 somites) and E9.0 (11–13 somites). Green is acetylated tubulin; blue is DAPI. Arrows point to the apical surface of neural plate; arrowheads point to the floor plate. The first region of tubulin acetylation in WT is in the floor plate, which is only region of tubulin acetylation in the mutant. Scale bar = 25 μm.


