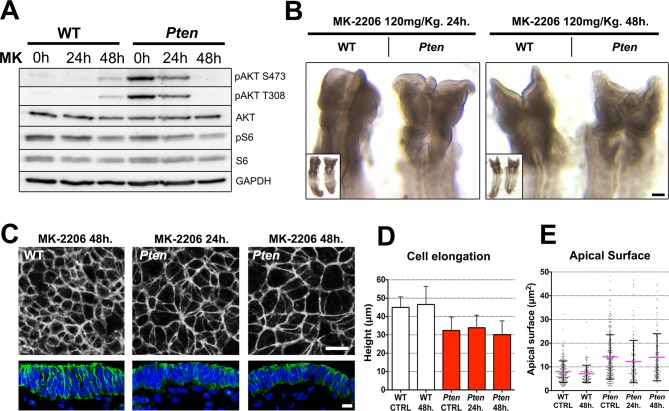
Figure 5. The Pten neural plate phenotype is independent of AKT.
(A) Effect of the AKT inhibitor MK-2206 treatment on targets of the PI3 kinase pathway in E8.5 embryos. Western blot of the two phosphorylated forms of AKT and pS6 S240/4 in WT and Pten △Epi at E8.5 in control embryos (vehicle) and after 24 or 48 hr of MK-2206 treatment in utero prior to embryo dissection. Numbers indicate approximate MW. (B) Dorsal view (inset) and enlarged image of the cephalic region of E8.5 wild-type and Pten △Epi embryos. There is no change in the morphology of the mutant heads after 24 or 48 hr of MK-2206 treatment in utero. Scale bar = 120 μm. (C) The apical surface of the neural plate, viewed en face. Cell borders marked by expression of ZO1 (white) (top row); acetylated tubulin (green) in transverse sections of cephalic neural epithelium in wild type and Pten △Epi at E8.5 after 24 or 48 hr of MK-2206 treatment in utero. Blue is DAPI. Scale bar = 10 μm. (D) Height of the E8.5 cephalic neural plate. Wild type, untreated (control) = 44.9 ± 5.7 μm; WT 48 hr treatment = 46.5 ± 9.9 μm; MK-2206 treatment had no significant effect. Pten △Epi untreated (control) = 32.4 ± 7.3 μm; Pten △Epi 24 hr = 33.9 ± 6.8 μm2; Pten △Epi 48 hr = 30.3 ± 7.5 μm. Treated and untreated mutants were all significantly shorter than wild type, but MK-2206 treatment did not significantly rescue cell elongation in the mutant. (E) Apical surface area of E8.5 cephalic neuroepithelial cells. Control = 8 ± 5 μm2; WT 48 hr = 7 ± 4 μm2; Pten △Epi Control = 14 ± 9 μm2; Pten △Epi 24 hr = 13 ± 9 μm2; Pten △Epi 48 hr = 14 ± 10 μm2. Treated and untreated mutant cells all had significantly larger surface area than wild type, but MK-2206 treatment did not significantly decrease cell surface area in the mutant.
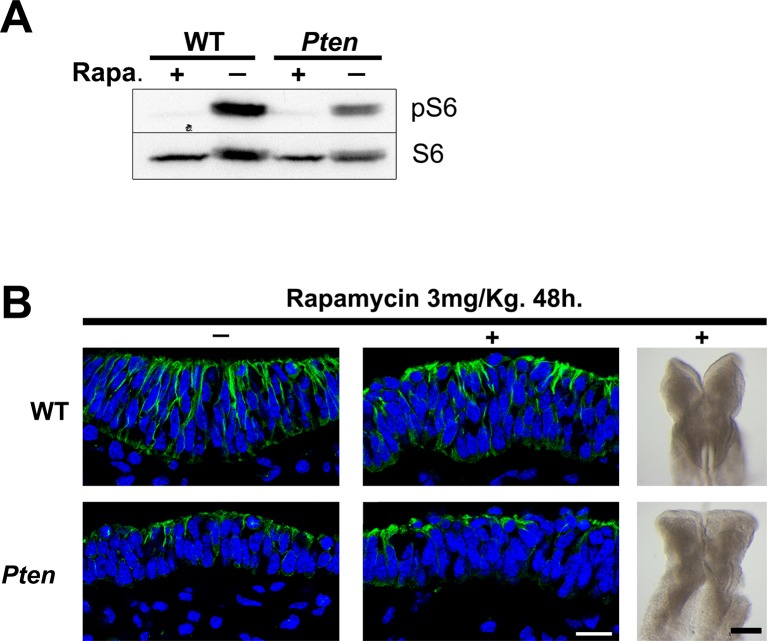
Figure 5—figure supplement 1. Inhibition of mTORC1 by rapamycin does not rescue the Pten neural plate phenotype.
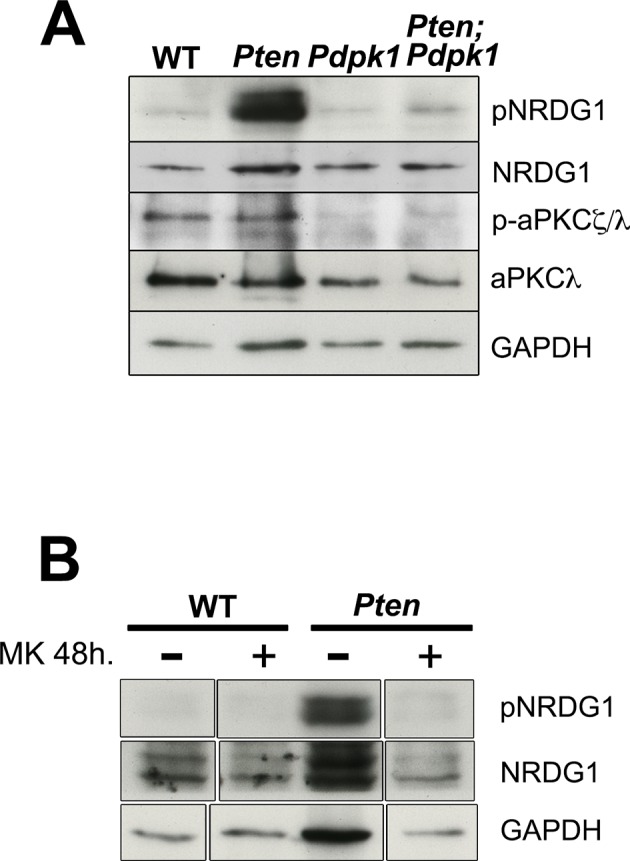
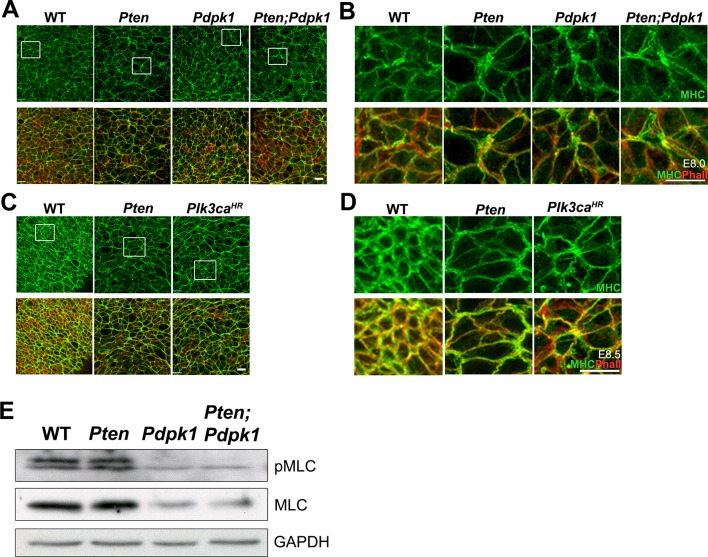
Figure 5—figure supplement 2. Downstream targets of PDPK1.


