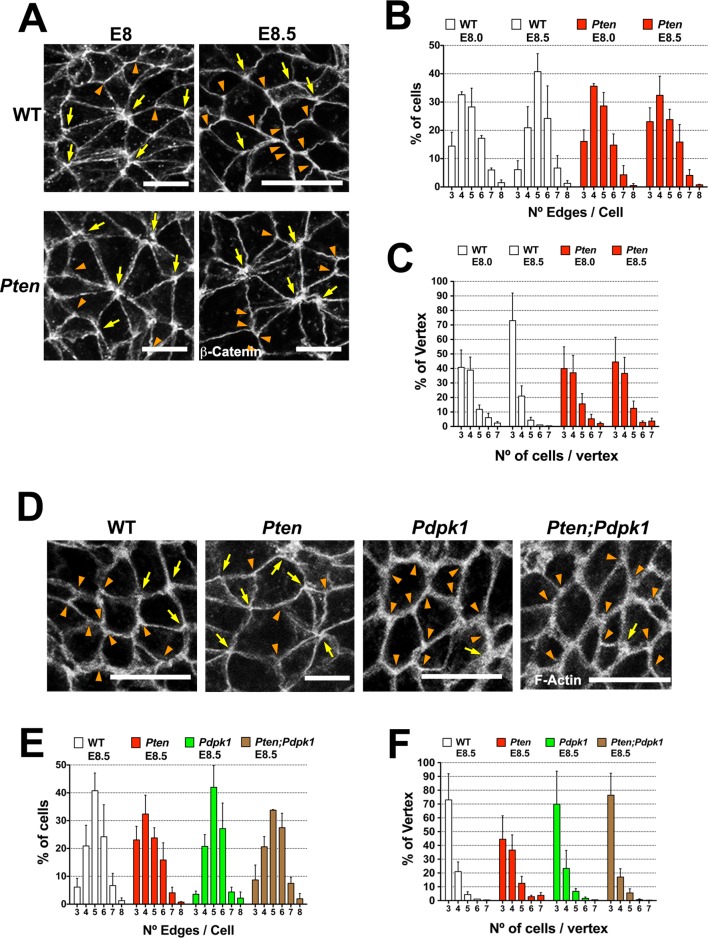
Figure 6. PTEN promotes stable cell packing in the neural plate.
Panels (A) and (D) show high magnification views of the apical surface of the neural plate embryos, with magnification adjusted so that the cells appear to be approximately the same size, in order to highlight the difference in cell packing in the two genotypes. Scale bars in (A) and (D) = 15 μm. Orange arrowheads indicate examples of 3 cells/vertex, and yellow arrows indicate vertices formed by ≥4 cells. Cell borders marked by β-catenin (A) or F-actin (D) expression. (A) At E8.0, rosette-like structures are common in both WT and Pten. Fewer rosette-like arrangements are seen in WT at E8.5, but rosettes persist in the E8.5 Pten neural plate. (B) Quantification of percentage of cells with 3–8 edges. Between E8.0 and E8.5, the percentage of cells with 3–4 edges decreases ∼45%, while the percentage with 5–6 edges increases ∼1.6 fold in WT embryos, but these parameters are unchanged in E8.5 mutants. (C) The percentage of vertices plotted against the number of cells meeting at a vertex. In a honeycomb arrangement, 3 cells meet at a vertex; the number of cases where three cells meet at a vertex increases ∼1.8 fold between E8.0 and E8.5, whereas the Pten neural plate does not changed in this interval. (D) At E8.5, Pdpk1 single and Pten Pdpk1 double mutants show packing similar to that in WT, compared to the more rosette-like packing in Pten. Quantification of % of cells with 3–8 edges (E) and % of vertices formed by 3–7 cells (F) showed similar values in E8.5 WT, Pdpk1 and Pten Pdpk1 embryos. Bars indicate %, lines indicate s.d.


