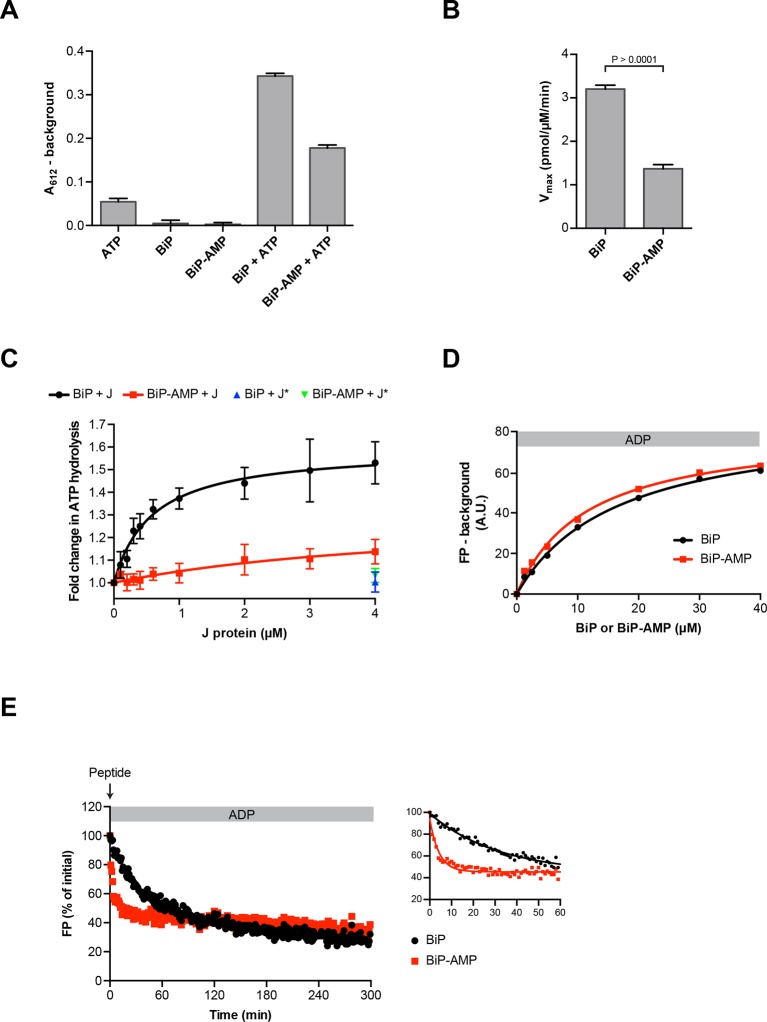
Figure 8. Functional consequences of BiP AMPylation in vitro.
(A) Bar diagram of ATP hydrolysis by BiP and BiP AMPylated to completion (BiP-AMP), as reflected in phosphate release (detected colorimetrically). Samples containing either purified BiP or BiP-AMP (both at 5 µM) were incubated with 3 mM ATP for 1 hr at 30°C and free orthophosphate generated by ATP hydrolysis was measured. Samples lacking BiP or ATP report on the assay background. Bar graph shows mean absorbance values ± SD at 612 nm (A612) of the complex between free orthophosphate and the malachite green dye after background subtraction of three repeats (n = 3). (B) Bar diagram of Vmax values for basal ATPase activities of unmodified and AMPylated BiP, derived from experiments as in “A”. Mean values ± SD are shown (n = 3). (C) Measurement of J protein-stimulated ATPase activity of unmodified and AMPylated BiP. Samples of purified BiP or BiP-AMP (both at 1.5 µM) were incubated in presence of 2 mM ATP with isolated J-domain of ERdj6 (J) at the indicated concentrations for 3 hr at 30°C and released orthophosphate was detected as in “A”. The control reactions contained 4 µM of non-functional ERdj6H422Q J-domain (carrying a mutation in the critical HPD motif; J*) instead of the wildtype J-domain. Shown is the J protein-dependent change in ATP hydrolysis rate of BiP and BiP-AMP relative to their basal ATP hydrolysis rates in absence of J protein (set to 1) of four experiments (values ± SD, n = 4). (D) Plot of concentration-dependent steady-state binding of substrate peptide by unmodified or AMPylated BiP. Fluorescence polarization (FP) of 1 µM lucifer yellow-labeled BiP substrate peptide (HTFPAVLGSC) was measured after incubation with purified BiP or BiP-AMP at the indicated concentrations for 24 hr at 30°C in presence of 1 mM ADP. Mean values of a representative experiment performed in triplicates are shown. (E) Plot of time-dependent release of fluorescently-labeled substrate peptide from unmodified or AMPylated BiP, following injection of 400-fold excess of unlabeled substrate peptide. Fluorescence polarization (FP) signal of lucifer yellow-labeled substrate peptide (1 µM) bound to BiP or BiP-AMP (both at 40 µM) in presence of 1 mM ADP (as in “D”) was measured after addition of 400-fold excess of unlabeled substrate peptide (0.4 mM) at t = 0. The initial values (after background subtraction) were set to 100% and non-linear regression analysis was performed on the first 60 min of peptide competition (inset). Mean values of a representative experiment performed in triplicates are plotted on the graph. The mean dissociation rate constants (koff) ± SD for BiP = 0.037 ± 0.006 min-1 and BiP-AMP = 0.212 ± 0.021 min-1 as well as the mean half-lives (t1/2) ± SD for BiP = 19.3 ± 2.9 min and BiP-AMP = 3.3 ± 0.3 min were calculated based on three independent experiments.
DOI: http://dx.doi.org/10.7554/eLife.12621.019

