. 2016 Jan 25;5:e11050. doi: 10.7554/eLife.11050

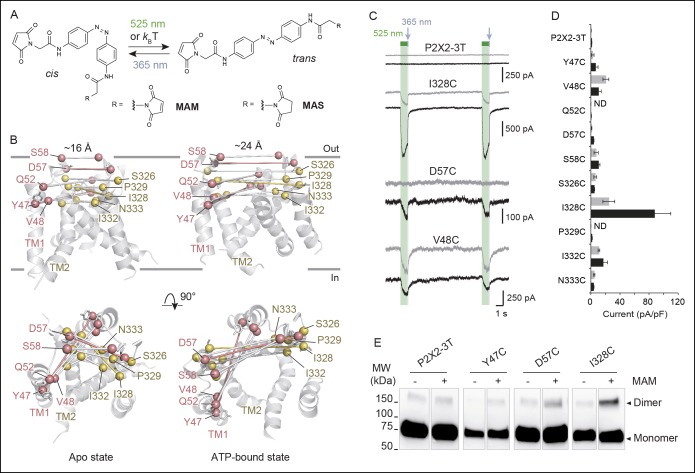
Figure 1. Lateral expansion between TM1 and TM2 helices drives channel opening.

(A) Chemical structures of MAM and MAS in the cis and trans states. (B) Cartoon representation of the TMD of a P2X2 homology model viewed parallel (upper) and perpendicular (lower) to the membrane plane in an apo (left) and ATP-bound state (right). Cβ atoms of residues selected for cysteine substitutions are shown as red and yellow spheres in TM1 and TM2 helices, respectively. Indicated values are the average distances separating pairwise β-atoms from two adjacent subunits (grey bridges). Highlighted bridges indicate actual MAM cross-linking. (C) Whole-cell currents recorded during and after illumination at 525 nm (green bars, 1 s) and 365 nm (violet arrows, 80 ms) in HEK cells expressing the P2X2-3T receptor or the indicated cysteine-substituted mutants after treatment with MAM (black traces) or MAS (gray traces). Just before recordings, cells were irradiated for 85 ms with a light pulse of 365 nm. (D) Screening for all constructs showing light-gated currents following MAM (filled bars) or MAS (gray bars) treatment. All light-gated mutants were activated at 525 nm and inactivated at 365 nm, except for N333C, which responded in the opposite sense to these wavelengths. ND stands for not determined (n = 4–5 cells; mean ± s.e.m.). (E) Western blot analysis of cell-surface cross-linking of the indicated P2X2-3T constructs expressed in TSA-201 cells after treatment (+) or without treatment (-) with MAM. Monomer and dimer are indicated. Uncut gel image is shown in Figure 1—figure supplement 2B. MAM: 4,4´-bis(maleimido-glycine)azobenzene; MAS: 4-(maleimido-glycine)-4'-(succimido-glycine)azobenzene; MW: Molecular weight; TMD: Transmembrane domain.

DOI: http://dx.doi.org/10.7554/eLife.11050.003

Figure 1—source data 1. Interatomic distances between pairwise residues.
DOI: 10.7554/eLife.11050.004
Figure 1—source data 2. Estimated EC50 and Hill coefficients for ATP activation.
DOI: 10.7554/eLife.11050.005

Figure 1.

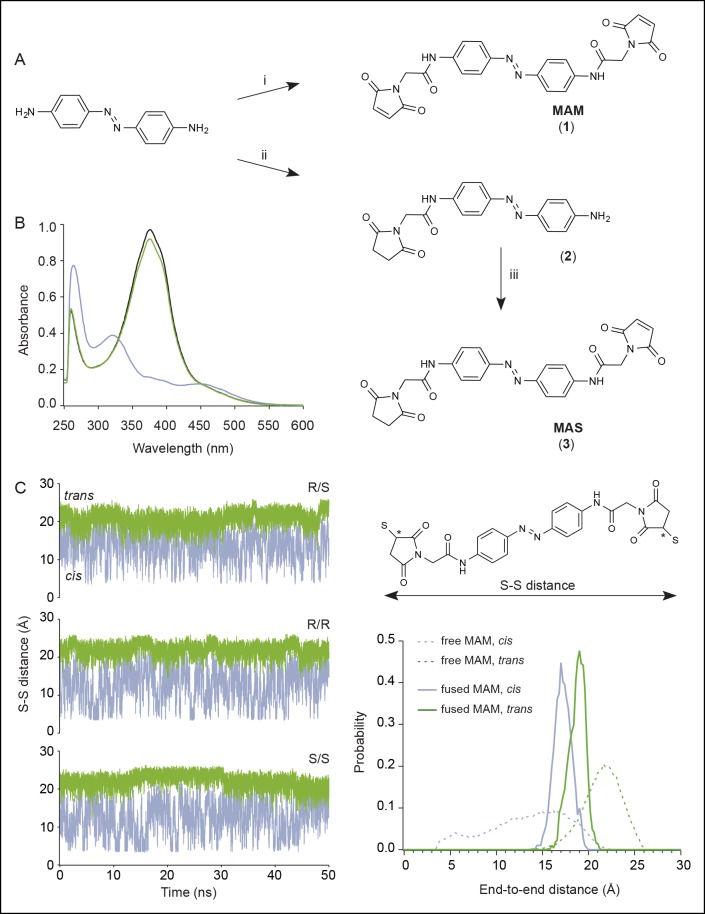
Figure 1—figure supplement 1. Chemical synthesis and physico-chemical properties of azobenzene derivatives.

Figure 1—figure supplement 1.

(A) Synthesis of MAM (1) and MAS (3); i) HATU, DIEA, 2-(2,5-dioxo-2,5-dihydro-1H-pyrrol-1-yl)acetic acid, ACN/DMF, 19 h, RT, ρ = 55%; ii) TBTU, Et3N, 2-(2,5-dioxopyrrolidium-1-yl)acetic acid, ACN/DMF, 19 h, RT, ρ = 27%; iii) HATU, DIEA, 2-(2,5-dioxo-2,5-dihydro-1H-pyrrol-1-yl)acetic acid, ACN/DMF, 19 h, RT, ρ = 60%. (B) UV/visible spectrum of MAM (30 μM) in DMSO in the dark (black trace), after illumination at 365 nm (violet trace) and subsequently at 525 nm (green trace). (C) Left, time series of the end-to-end distance of free MAM in bulk water determined from six 50 ns-long MD simulations in either cis (violet) or trans configuration (green). Shown is the S–S distance computed from two sulfur atoms of the three stereoisomers (R/S, R/R, and S/S) following reaction with maleimides as shown in the top right. Asterisks indicate stereocenters. Bottom right, normalized probability distributions for the end-to-end distance of MAM either free in solution (thin dashed lines, S–S distance) or fused to the protein in the new model of the open state (thick lines, Cβ–Cβ distance) in either trans (one horizontal MAM) or cis (three vertical MAM photo-linkers) configurations. MAM: 4,4´-bis(maleimido-glycine)azobenzene. MAS: 4-(maleimido-glycine)-4'-(succimido-glycine)azobenzene.
Figure 1—figure supplement 2. Horizontal screening confirms an outward expansion of the TM helices.
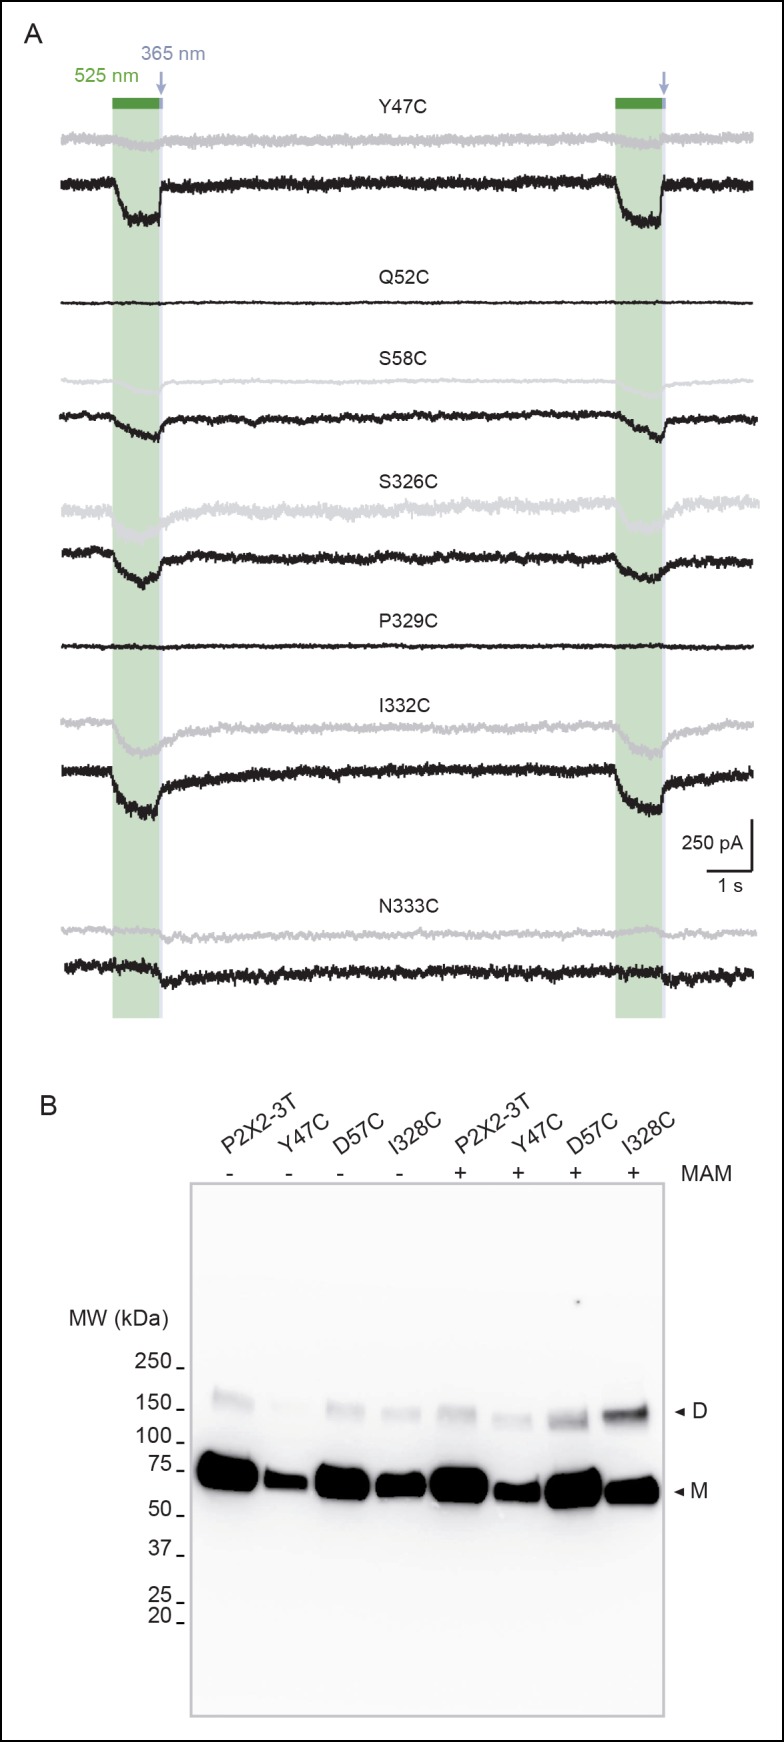
Figure 1—figure supplement 2.

(A) Whole-cell currents evoked by light at the indicated wavelengths in cells expressing the indicated cysteine-substituted mutants after treatment with MAM (black traces) or MAS (grey traces). Just before recordings, cells were briefly irradiated with a light pulse of 365 nm, except for N333C mutant. (B) Uncut gel image of cross-linked P2X2-3T subunits from Figure 1E. MAM: 4,4´-bis(maleimido-glycine)azobenzene; MAS: 4-(maleimido-glycine)-4'-(succimido-glycine)azobenzene; TM: Transmembrane.
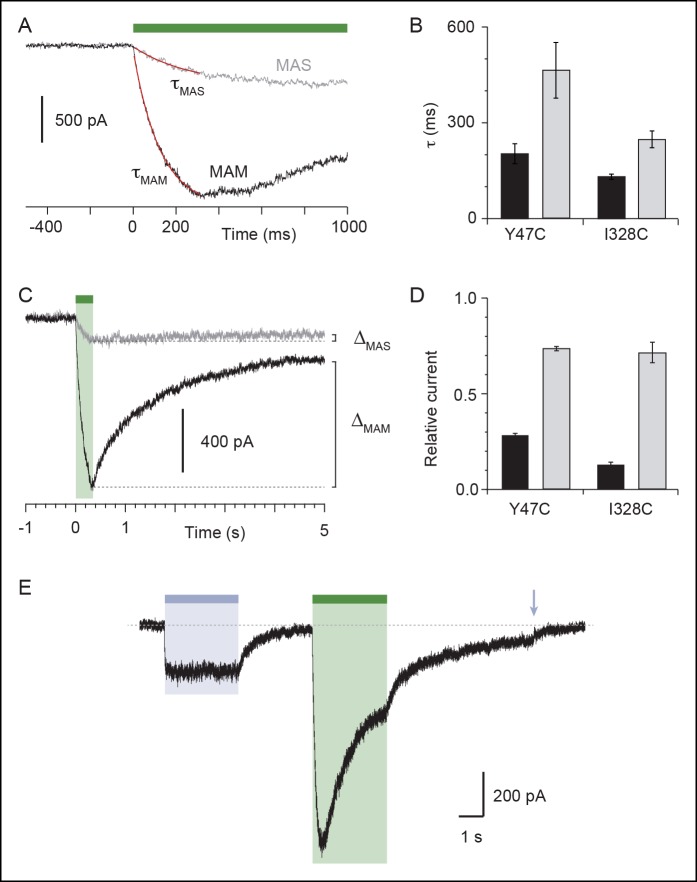
Figure 1—figure supplement 3. Characterization of currents induced by the isomerization of azobenzene compounds attached at the I328C or Y47C mutant.

Figure 1—figure supplement 3.

(A) Light-induced whole-cell currents in I328C mutant treated with MAS (grey trace) or MAM (black trace). Just before recording, cells were irradiated with a light pulse of 365 nm. Data were best fit with a single exponential function (red traces) giving the time constant (τ) of receptor activation. (B) Bar plot showing time constants of activation during illumination at 525 nm for Y47C and I328C receptors treated with MAS (grey bars) or MAM (black bars) (n = 4–8 cells; mean ± s.e.m.). (C) Light-induced whole-cell currents in I328C mutant treated by MAS (grey trace) or MAM (black trace) shown on a different time scale. ΔMAS and ΔMAS indicate current stability, which was defined as the ratio of currents measured 5 s after 525 nm illumination and currents measured at the peak. (D) Bar plot showing the current stability for Y47C or I328C mutant treated with MAS (grey bars) or MAM (black bars) (n = 4–8 cells; mean ± s.e.m.). (E) Whole-cell current evoked by 365 nm and 525 nm illumination recorded from a cell expressing the I328C mutant. At the end of the recording, channels were turned off by a brief illumination at 365 nm (arrow). Before recording, the cell was briefly irradiated at 365 nm.
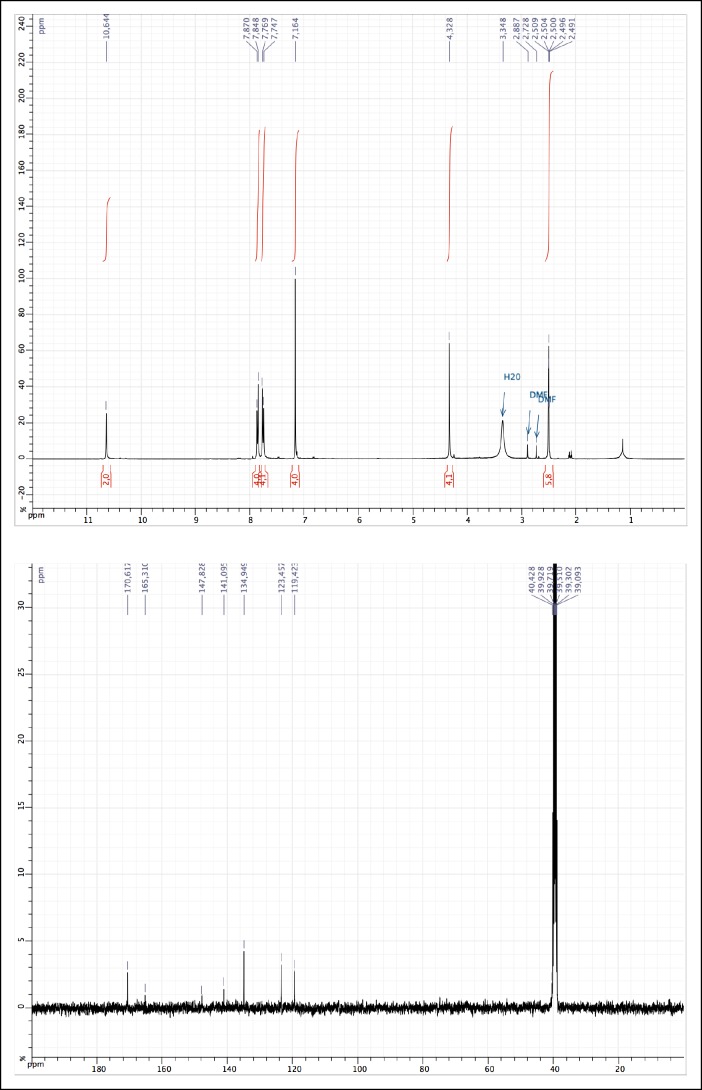
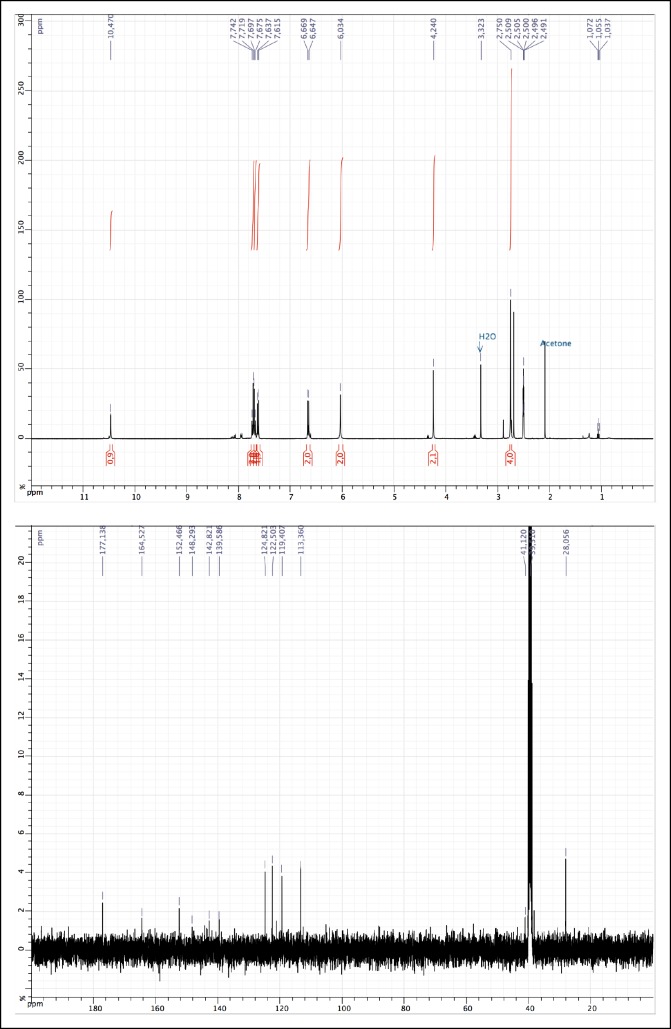
Figure 1—figure supplement 4. 1H and 13C NMR of MAM (1).

Figure 1—figure supplement 4.

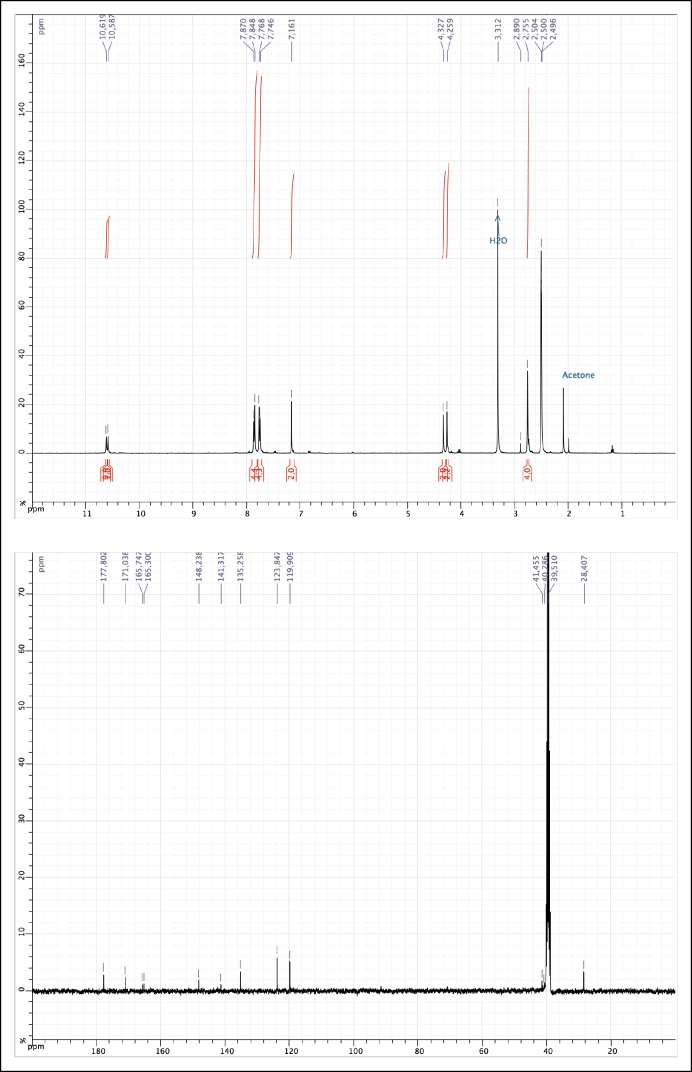
Figure 1—figure supplement 5. 1H and 13C NMR of 2.

Figure 1—figure supplement 5.

Figure 1—figure supplement 6. 1H and 13C NMR of MAS (3).

Figure 1—figure supplement 6.