. 2016 Jan 25;5:e11050. doi: 10.7554/eLife.11050

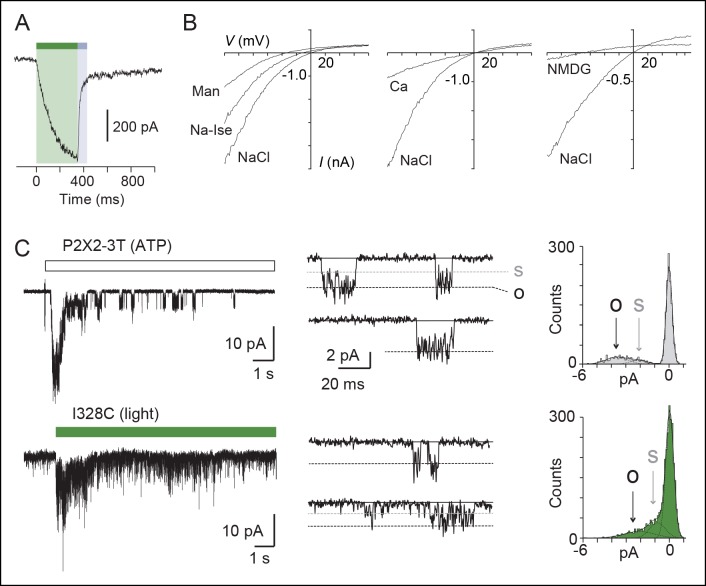
Figure 2. Light-driven open states are similar to those induced by ATP in the I328C mutant.

(A) Optimized illumination times at 525 nm (green bar, 350 ms, 4.1 mW/mm2) and 365 nm (violet bar, 80 ms, 8.1 mW/mm2) of I328C mutant treated with MAM to observe maximal opening and closing. (B) Current-voltage curves recorded in different extracellular solutions (Man, mannitol; Na-Ise, sodium isethionate; Ca, calcium; NaCl, symmetrical NaCl external solution; NMDG, N-methyl-D-glucamine). Shown are light-gated currents obtained after subtracting peak photocurrents recorded at 525 nm light to those obtained in the dark after switching to 365 nm light. (C) Left, single-channel currents recorded from outside-out patches at -120 mV in response to ATP for the P2X2-3T (10 μM, upper panel) or to 525 nm illumination for I328C mutant treated with MAM (4.1 mW/mm2, lower panel). In these conditions, both ATP- and light-gated currents correspond to ~30% of a maximal ATP response. Middle, unitary currents shown on an expanded scale. Full (O) and sublevel (S) openings are indicated by dashed black and gray lines, respectively. Black lines indicate closed channels. Right, corresponding all-points histograms, fitted to the sum of three Gaussians. Full and sublevel openings are also indicated.

DOI: http://dx.doi.org/10.7554/eLife.11050.013

Figure 2—source data 1. Relative ion permeability for chloride.
DOI: 10.7554/eLife.11050.014
Figure 2—source data 2. Relative ion permeability for calcium.
DOI: 10.7554/eLife.11050.015
Figure 2—source data 3. Relative ion permeability for NMDG.
DOI: 10.7554/eLife.11050.016
Figure 2—source data 4. Single-channel properties of light-gated and ATP-gated receptors.
DOI: 10.7554/eLife.11050.017

Figure 2.

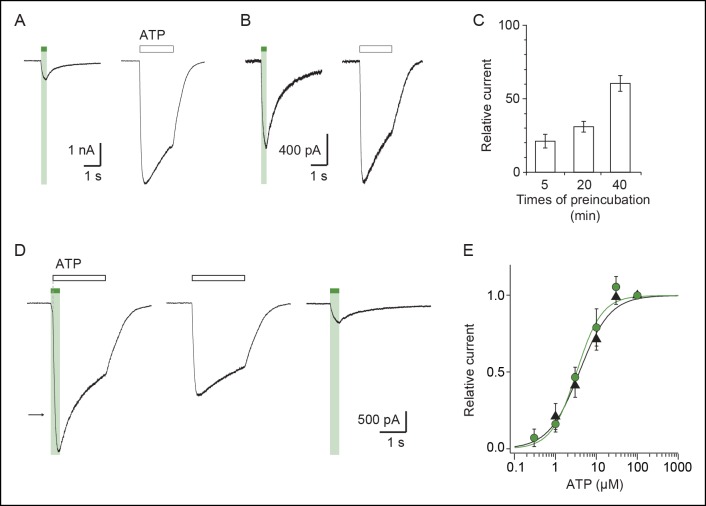
Figure 2—figure supplement 1. Kinetics of MAM labeling and effect of light on ATP currents in cells expressing the I328C mutant.

Figure 2—figure supplement 1.

Whole-cell currents evoked by illumination at 525 nm light or by a saturating concentration of ATP (100 μM) recorded from the same cells that were preincubated with MAM for 5 (A) or 40 min (B). (C) Bar plot showing the relative current defined as the ratio of light-gated currents to ATP-gated currents for different times of MAM preincubation (n = 7–9 cells). (D) Left, whole-cell current evoked by a saturating concentration of ATP (100 μM) is potentiated by a short (350 ms) visible light irradiation that slightly precedes ATP application. Control currents evoked by 100 μM ATP (middle) or 525 nm light irradiation alone (right) are shown from the same cell. Preincubation time with MAM was 20 min. The arrow indicates the predicted current if ATP-gated and light-gated currents at 525 nm were additive. (E) Concentration–response relationships for ATP at 525 nm (green circles, time irradiation: 350 ms) or in the dark after illumination at 365 nm (filled triangles) from cells treated with MAM for 20 min (n = 4 cells; mean ± s.e.m.). Currents were normalized to 100 μM ATP. The Hill equation was fit to the data.
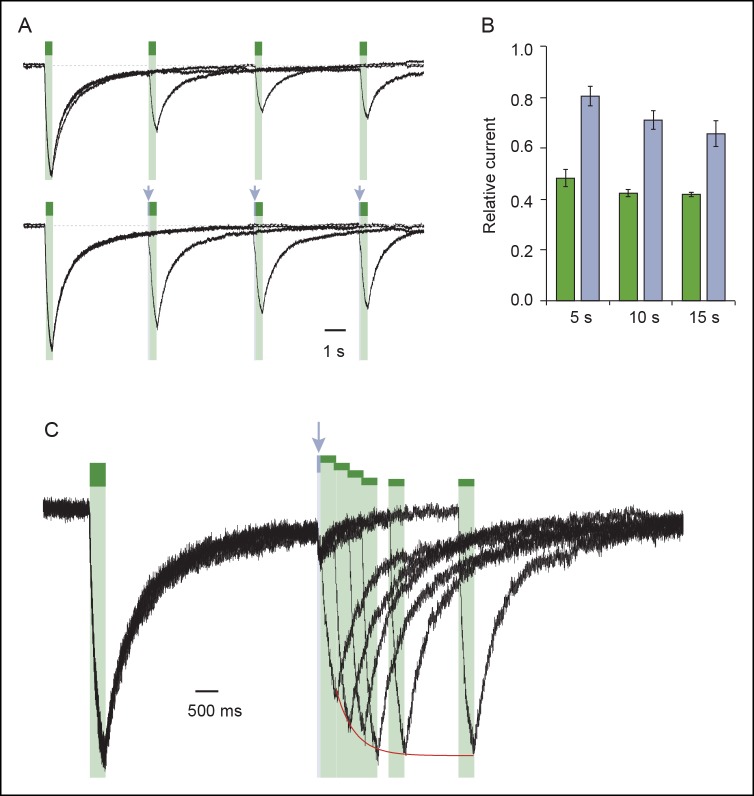
Figure 2—figure supplement 2. Exploration of desensitization and resensitization of the I328C mutant treated with MAM.

Figure 2—figure supplement 2.

(A) Superimposed light-gated currents from the same cell desensitize as monitored by subsequent activation at different waiting times (upper panel). Desensitization was less pronounced if a very short pulse of UV light (80 ms) is delivered just before activation (indicated by arrows, bottom panel). In each case, cells were briefly shone at 365 nm before recordings to resensitize receptors. (B) Bar plot showing the ratio of maximal current recorded in the second to first irradiation with (violet bars) or without (green bars) the short pulse at 365 nm (n = 4 cells; mean ± s.e.m.) at different waiting times. (C) Superimposed light-gated currents from the same cell slowly recover from desensitization after a short UV light (arrow) as monitored by subsequent activations performed at different times. The red line depicts the recovery time course (τ = 396 ± 27 ms, n = 3; mean ± s.e.m.). MAM: 4,4´-bis(maleimido-glycine)azobenzene.