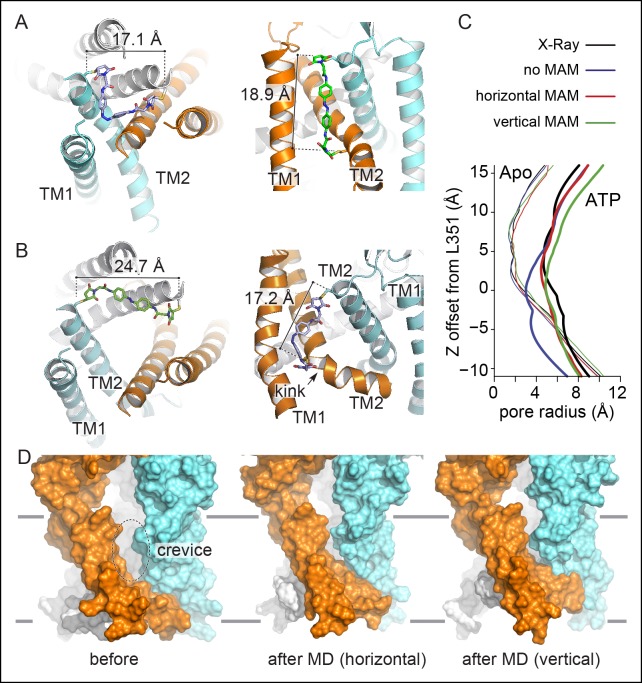
Figure 5. Molecular dynamics of zfP2X4 open-channel state cross-linked by MAM reduce inter-subunit interface in the TMD.
(A) Cartoon representation of the TMD of zfP2X4 receptor simulated in the closed state after MD, in which MAM (in stick representation) is conjugated horizontally between two I336C (cis configuration, left) or vertically between I336C and N353C (trans configuration, right). For clarity, only one MAM is shown vertically. Distances separating Cβ atoms of engineered cysteines are 17.1 ± 0.5 Å (n = 800) and 18.9 ± 0.9 Å (n = 2400). (B) Same views of the TMD simulated in the open state. Distances separating Cβ atoms are 24.7 ± 0.6 Å (n = 800) and 17.2 ± 1.0 Å (n = 2400). TM1 and TM2 helices and the location of a kink in one of the three TM2 helices are also shown. (C) Transmembrane pore radius along the axis of the ion channel for the apo (thin lines) and ATP-bound (thick lines) states. The profiles were calculated considering the backbone atoms only (see Materials and methods) and were derived from the X-ray structures (black) or models obtained after MD relaxation computed with (red and green) or without MAM (blue) as indicated. In the absence of MAM, the open state rapidly closes in MD simulations near L351 (rP2X2: V343). (D) Lateral view of the channel displayed in surface representation before (left) and after MD following MAM attachment between two I336C (middle) or between I336C and N353C (right). MAM: 4,4´-bis(maleimido-glycine)azobenzene; MD: Molecular dynamics; TMD: Transmembrane domain.
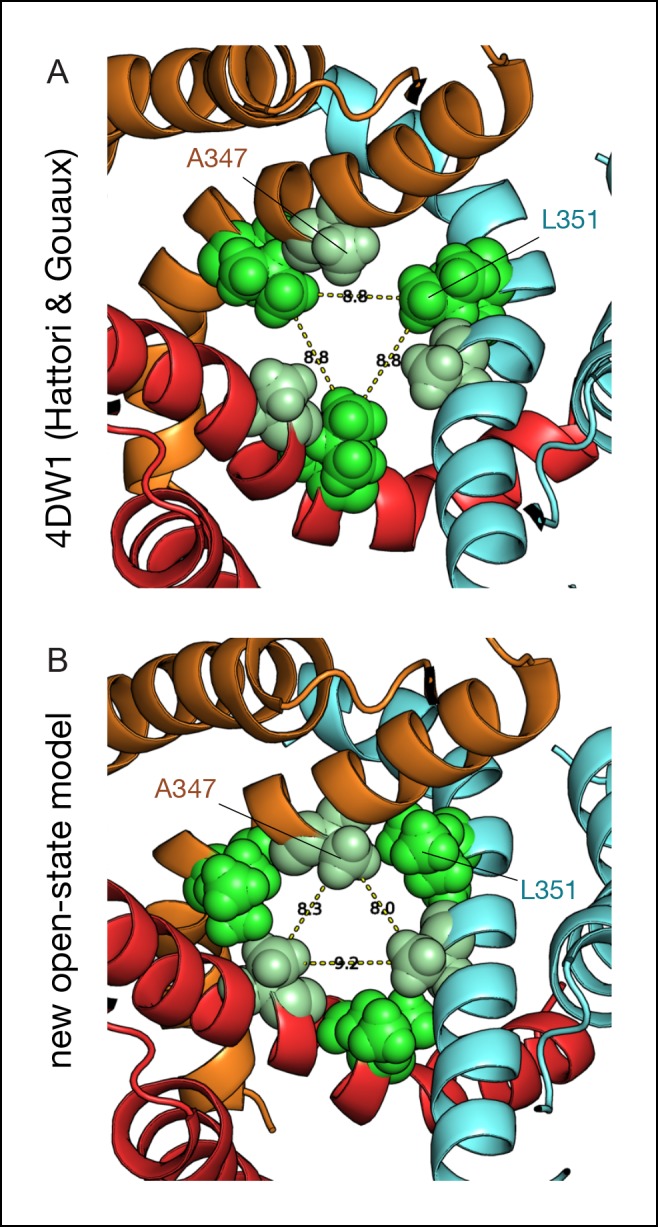
Figure 5—figure supplement 1. Comparison between the ATP-bound crystal structure and the new model of the open state.


