. 2016 Jan 26;5:e11473. doi: 10.7554/eLife.11473

Figure 1. Phylogenetic network analysis.

SplitsTree phylogenetic networks were constructed using (A) each isolate for the collection of T.b. brucei (Tbb), T.b. rhodesiense (Tbr), T.b. gambiense Group 1 (Tbg1) and T.b. gambiense Group 2 (Tbg2) and (B) for just T.b. gambiense Group 1 isolates. The number of samples in each group is indicated in parenthesis.

DOI: http://dx.doi.org/10.7554/eLife.11473.003
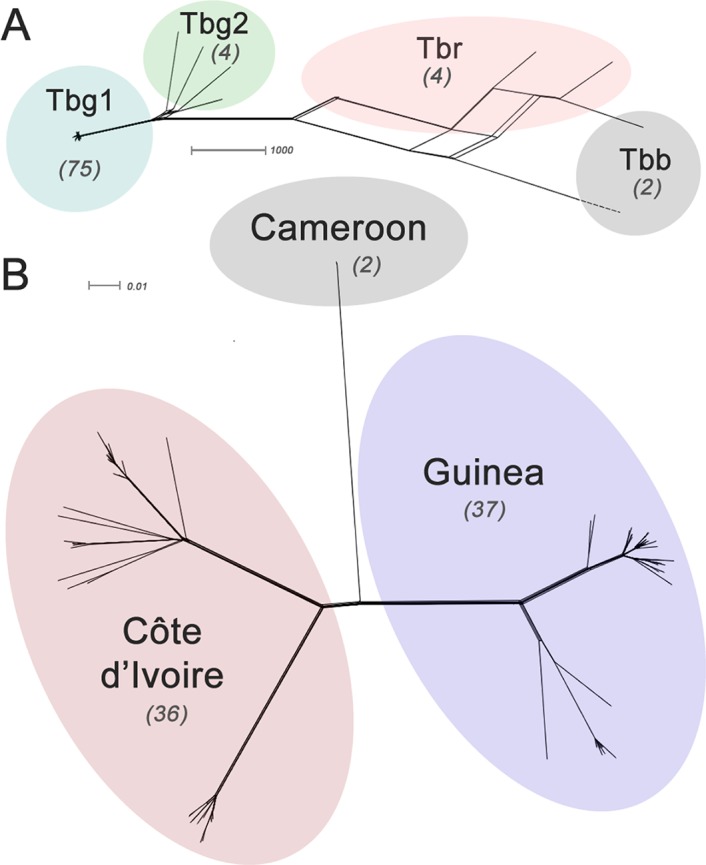
Figure 1—source data 1. Number of SNP loci with respect to different sub-species.
DOI: 10.7554/eLife.11473.004
Figure 1—source data 2. Testing Hardy-Weinberg Equilibrium (HWE) across the T.b. gambiense Group 1 genome.
DOI: 10.7554/eLife.11473.005
Figure 1—source data 3. FIS by sub-population.
DOI: 10.7554/eLife.11473.006
Figure 1—source data 4. Number and type of T.b. gambiense Group 1 SNPs.
DOI: 10.7554/eLife.11473.007

Figure 1.

Figure 1—figure supplement 1. Genome-wide SNP density map for each sub-species.

Figure 1—figure supplement 1.

The densities of SNP loci were assessed among isolates of (a) T.b. brucei (n=2), (b) T.b. gambiense Group 1 (n=75), (c) T.b. gambiense Group 2 (n=4) and T.b. rhodesiense (n=4) over each of the 11 chromosomes (horizontal scale). The number of SNPs per 10Kb window is plotted in blue, with the scale indicating SNP density between 0 and 150 loci per window (vertical scale). T.b. gambiense Group 1 isolates have a SNP density, which is approximately ten-fold lower than other sub-species, however they are evenly distributed throughout the genome.

Figure 1—figure supplement 2. Weir and Cockerham’s fis.
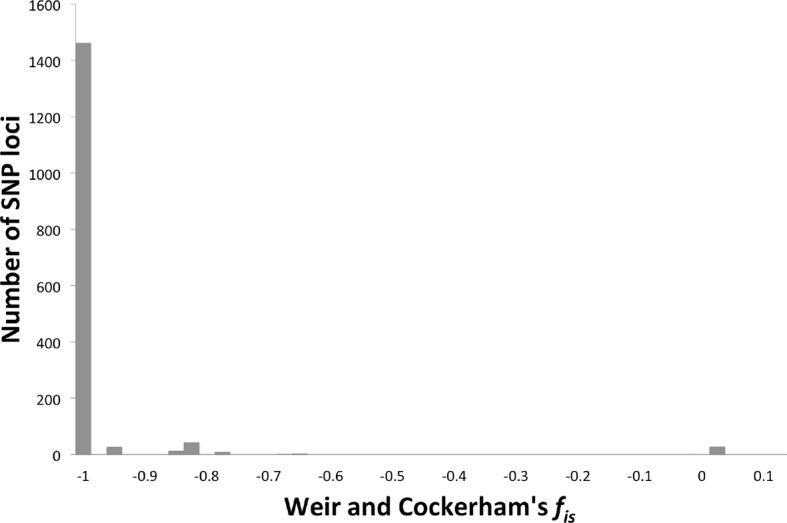
Figure 1—figure supplement 2.

The number of SNP loci exhibiting different levels of fis (Weir and Cockerham’s fis (Goudet, 1995)) was plotted, showing a distribution around -1, indicating strict asexuality.

Figure 1—figure supplement 3. Genome-wide linkage disequilibrium (LD) among T.b. gambiense Group 1 parasites.
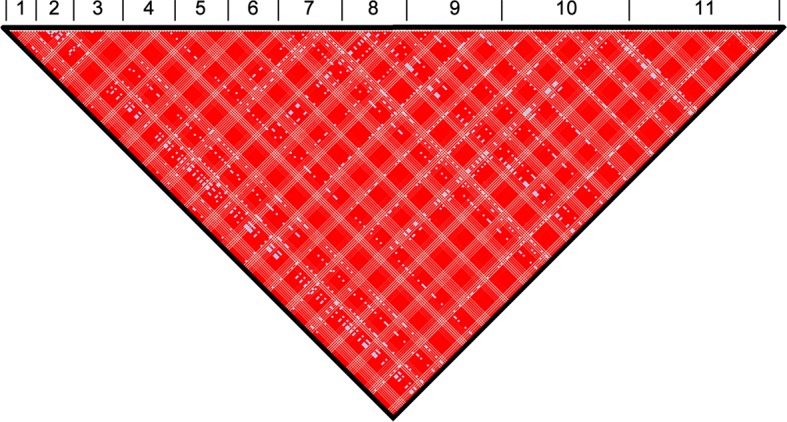
Figure 1—figure supplement 3.

Normalised LD was assessed across all eleven chromosomes. The position of each SNP used in this analysis is illustrated. The black triangle illustrates the single linkage group identified in the analysis, which spans the entire genome. Numbers 1–11 represent the 11 chromosomes. Red (D'>1, LOD≥2), Pink (D'<1, LOD≥2), Blue (D'=1, LOD<2) and White (D'<1, LOD<2).