. 2016 Jan 26;5:e11473. doi: 10.7554/eLife.11473

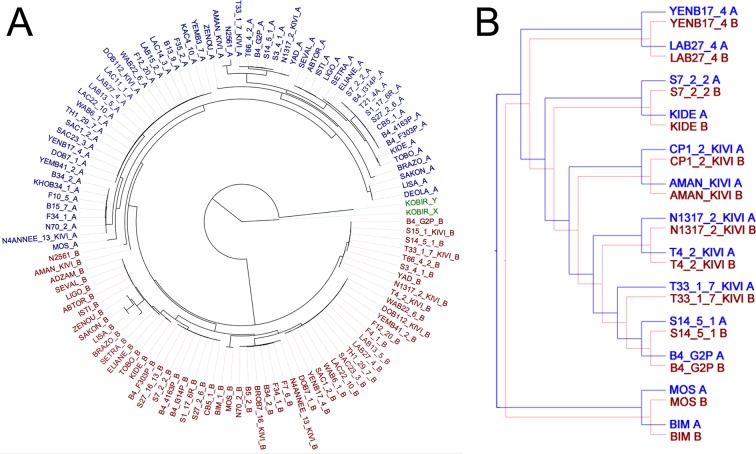
Figure 4. Haplotype co-evolution of chromosome 8.

(A) Phylogenetic tree of phased haplotype sequences of chromosome 8 shows a complete divergence between A (blue) and B (red) haplotypes of T.b. gambiense Group 1 (identical genotypes removed). The tree is rooted using a Group 2 isolate (green); (B) Co-phylogenetic analysis reveals 100% consensus between the A and B haplotype trees of a subset of T.b. gambiense Group 1 isolates.

DOI: http://dx.doi.org/10.7554/eLife.11473.016

Figure 4—source data 1. Co-phylogenetic analysis.
DOI: 10.7554/eLife.11473.017

Figure 4.

Figure 4—figure supplement 1. Phylogenetic trees of phased data showing ‘A’ and ‘B’ haplotypes.
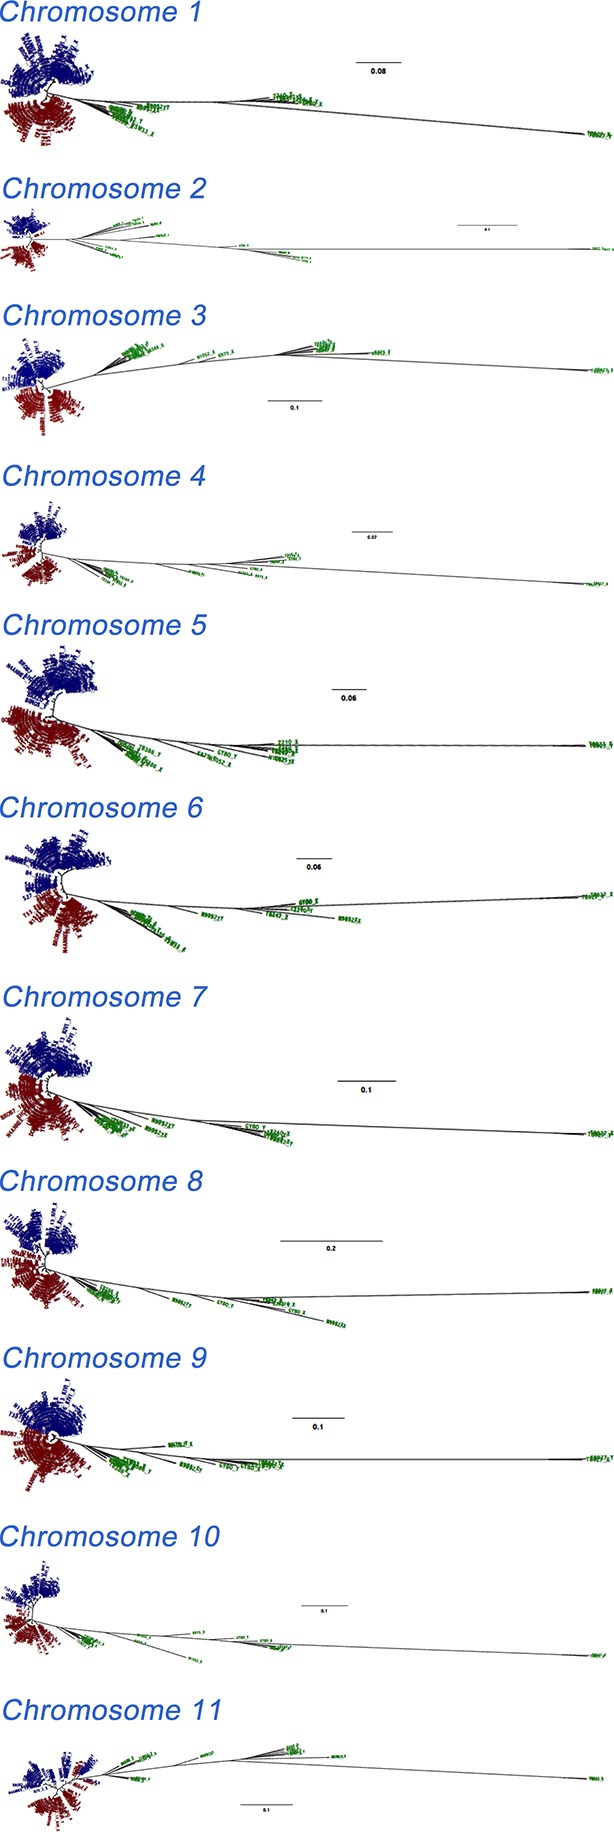
Figure 4—figure supplement 1.

Maximum likelihood phylogenetic trees of phased haplotype sequences demonstrate divergence between A (blue) and B (red) haplotypes of T.b. gambiense Group 1 over each of the 11 chromosomes. This represents all SNP loci identified in each sub-species (n = 230,891). The haplotypes of non-Group 1 isolates are shown in green. Divergence of A and B haplotypes of Group 1 isolates can be observed for every chromosome.

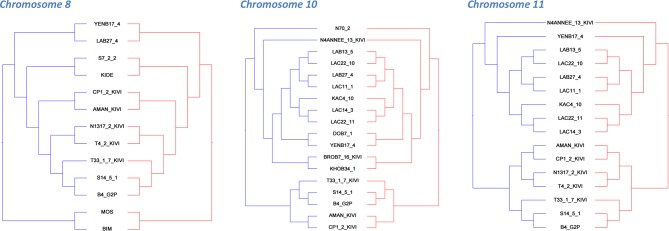
Figure 4—figure supplement 2. Co-phylogenetic analysis.

Figure 4—figure supplement 2.

For the three chromosomes with more than 1,000 SNP loci (Figure 1—source data 4), subsets of isolates (discriminated by highly supported nodes, see Materials and methods) were used to construct haplotype trees. In each case, the A and B haplotype trees show identical topology, illustrating the co-evolution of partner haplotypes.

Figure 4—figure supplement 3. Phylogenetic tree of all T.b. gambiense Group 1 isolates.

Figure 4—figure supplement 3.

A maximum likelihood phylogenetic tree was constructed with all T.b. gambiense Group 1 isolates using the panel of SNPs associated with derived alleles (Figure 1—source data 4). Bootstrap support is shown for each node. The 27 isolates chosen to illustrate co-evolution of partner haplotypes in Figure 4—figure supplement 2 are shown in blue (Guinea) and red (Côte d'Ivoire). The clade used for molecular clock calculations is marked with an asterisk.