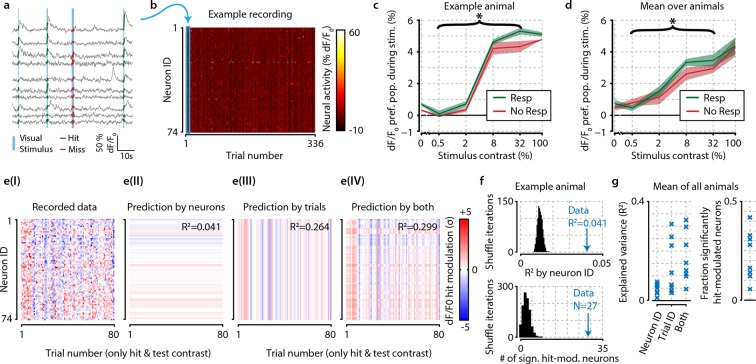
Figure 2. The difference in neural activity between hit and miss trials can be partly explained by consistent hit-associated increases in activity of specific neurons, and somewhat better by trial-by-trial population-wide fluctuations, but these mean-based approaches fall short of being fully descriptive.
(a) Recorded traces from 10 randomly selected neurons over four subsequent trials. For further analysis, we took the mean dF/F0 per neuron over the visual stimulation period (thick colored lines) as single mean neural activity measure per trial. (b) Data of one entire recording block consisting of 74 tuned and simultaneously recorded neurons over 336 trials. Blue rectangle shows the four trials depicted in panel (a). (c) In an example animal, the detection of stimuli (green) with test contrasts (0.5–32%) correlated with a modest increase in preferred population dF/F0 over undetected stimuli (red) (two-sample t-test, p<0.05) but none of the individual contrasts reached statistical significance (resp. vs. no resp., two-sample t-tests, FDR-corrected p>0.05). (d) As (c), but for mean over all animals the graph shows a small, but consistent overall difference of dF/F0 with visual detection (test contrasts 0.5–32%, n=8 animals, p<0.05). (c, d) Shaded areas show the standard error of the mean. (e) The hit-associated increase in neural activity per neuron for all hit trials of test contrast stimuli (panel I) can be partly explained by specific neurons showing consistent dF/F0 increases or decreases across trials (panel II) partly by trial-by-trial population-wide fluctuations regardless of neuronal identity (panel III) and somewhat better by both (panel IV). (f) Control analysis by shuffling neuronal identities (IDs) per trial (n=1000 iterations, black distribution) shows that the population activity is more predictable based on consistent hit modulations per neuron (top panel) and more neurons are significantly hit-modulated (bottom panel) than can be expected by chance. (g) Analyses as in (f), but across animals; comparison versus shuffle-based R2-expectation showed above-chance (at α=0.05) predictability of hit modulations using neuron ID, trial ID or both for respectively 7/8, 8/8, and 8/8 animals (left panel). The fraction of significantly hit-modulated neurons was above chance (at α=0.05) for 7/8 animals (right panel).


