Figure 3. Neuronal response heterogeneity within populations correlates better with visual detection than mean preferred population (pref. pop.) activity.
(a) Neuronal activity as in Figure 2d, but presented as z-score normalized per contrast to be able to compare relative changes across contrasts. (b) Schematic representation of the method to compute heterogeneity on an example trial (see also ‘Materials and methods’). The dF/F0 response of each neuron is z-scored per contrast and the distance (absolute difference) in z-scored activity between all pairs of neurons is calculated for each trial (color-coded ΔZ-score). The population heterogeneity in a given trial is defined as the mean ΔZ-score over all neuronal pairs. (c) Population activity heterogeneity in an example animal shows a strong correlation with visual detection. Comparison between detected (resp.) and undetected (no resp.) trials for test contrasts as a group (paired t-test, p<0.001) was highly significant. (d) As (c), but showing mean over all animals (n=8). Stimulus detection correlated with higher heterogeneity; test contrast group hit–miss comparison was highly significant (p<0.001). (e) As (d), but for heterogeneity within the preferred (left panel) and within the nonpreferred (right panel) population only. Hit–miss differences were found in the preferred population (test contrast group, p<0.01) and nonpreferred population (test contrast group, p<0.01) similar to the whole population (d). (f) Using a measure of effect size analysis (Cohen’s d), heterogeneity was found to show a stronger correlation with stimulus detection than mean dF/F0 within the whole population (Cohen’s d=0.114 vs. d=0.218); within the preferred population (Cohen’s d=0.119 vs. d=0.213) and within the nonpreferred population (Cohen’s d=0.110 vs. d=0.206) [paired t-tests over animals (n=8) whole population; p<0.05, preferred population; p<0.05, nonpreferred population; p<0.01]. (g) Example receiver operating characteristic (ROC) curve showing the linear separability of single-trial hit and miss trials using population heterogeneity (see ‘Materials and methods’). The separability can be quantified by the area under the curve (AUC; blue shaded area). True positive rate: fraction of hit trials classified as hit. False positive rate: fraction of miss trials classified as hit. (h) Statistical quantification of hit/miss separability using either mean dF/F0 (black) or heterogeneity (red) across animals (n=8). Both measures predict the animal’s response above chance (FDR-corrected paired t-test dF/F0 and heterogeneity AUC vs. 0.5, p<0.05 and p<0.001, respectively) but behavior can be predicted better using heterogeneity (paired t-test, dF/F0 vs. heterogeneity AUC, p<0.01). All panels: shaded areas/error bars show the standard error of the mean. Statistical significance: *p<0.05; **p<0.01; ***p<0.001.

Figure 3—figure supplement 1. Contrast-dependent responses of the preferred, nonpreferred, and whole population show distributed hit-correlated modulations in heterogeneity, but modulations in mean dF/F0 are smaller and only significant for the preferred population.

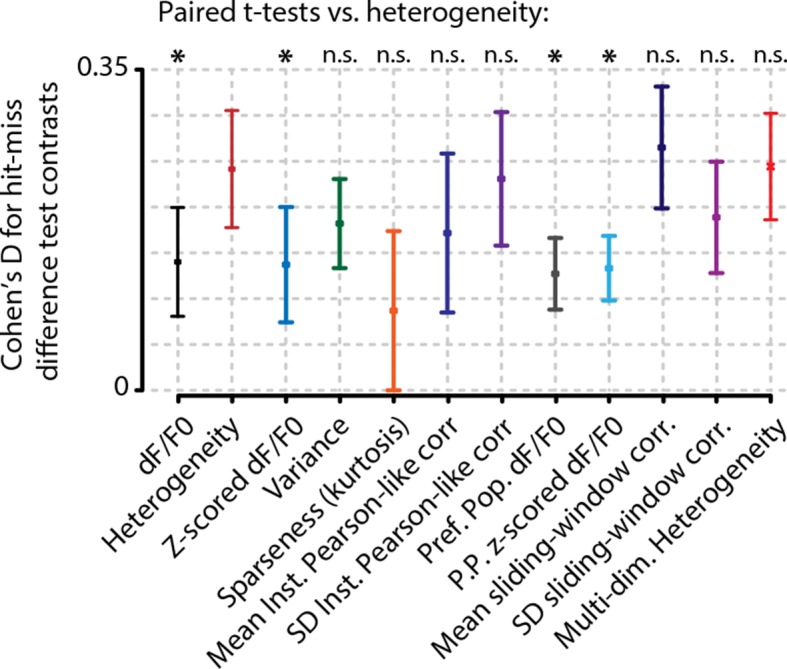
Figure 3—figure supplement 2. Analysis of hit/miss effect size (Cohen’s d) shows that simple average perform worst at separating hit from miss responses.