. 2015 Dec 8;4:e10163. doi: 10.7554/eLife.10163

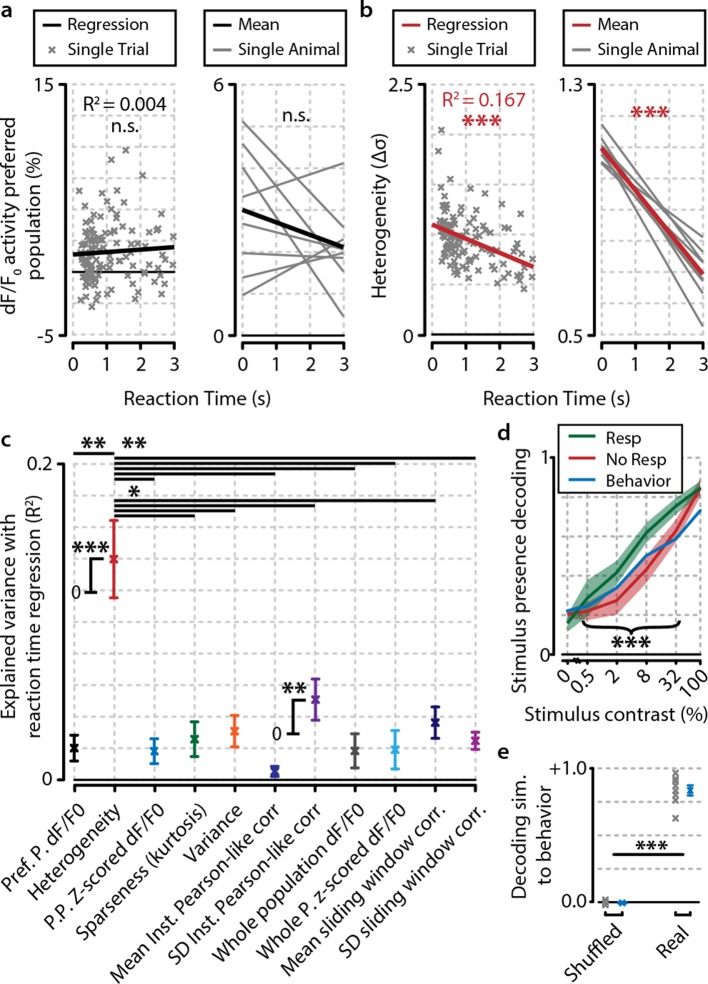
Figure 4. Heterogeneity is correlated with reaction time.

(a) Reaction time shows no correlation with mean preferred population dF/F0 activity during stimulus presentation for any individual animal (left panel; example animal) nor for the meta-analysis over animals (right panel; FDR-corrected one sample t-test over individual regression slopes per animal, n=8, n.s.). (b) Same as (a) but for heterogeneity. Heterogeneity shows a strong correlation with reaction time (left panel; example animal, p<0.001) as well as well for the meta-analysis over animals (p<0.001). (a, b) Note different y-axis scaling per panel for display purposes. (c) Comparison of the explained variance of several neural metrics. Only heterogeneity (FDR-corrected one sample t-test, p<0.001) and spread (SD) in instantaneous Pearson-like correlation (see ‘Materials and methods’) (p<0.01) correlate significantly with reaction time; all other metrics do not [preferred-population (Pref. P.) dF/F0, preferred-population (P.P.) z-scored dF/F0, variance, sparseness (kurtosis) mean instantaneous Pearson-like correlation, whole-population (z-scored) dF/F0, mean and SD of sliding window correlation (width 1.0 s); all n.s.]. Heterogeneity explains more reaction-time-dependent variance than any other metric (FDR-corrected paired t-tests, all p<0.05). (d) Decoding of stimulus presence shows similar accuracy as actual behavioral performance by the animals (Figure 1e). When the animal has detected the stimulus (resp.; green line), the decoder is better able to correctly judge its presence (a value of 1 indicates perfect performance, paired t-test, p<0.001). Shaded areas show the standard error of the mean. (e) Behavioral detection performance is more similar (sim.) to the optimal decoder’s performance than expected by chance (paired t-test, n=8 animals, shuffled vs. real similarity, p<0.001). Gray: single animal; blue: mean across animals. All panels: error bars/shaded regions show standard error of the mean. Statistical significance: *p<0.05; ***p<0.01; ***p<0.001.

DOI: http://dx.doi.org/10.7554/eLife.10163.011

Figure 4.

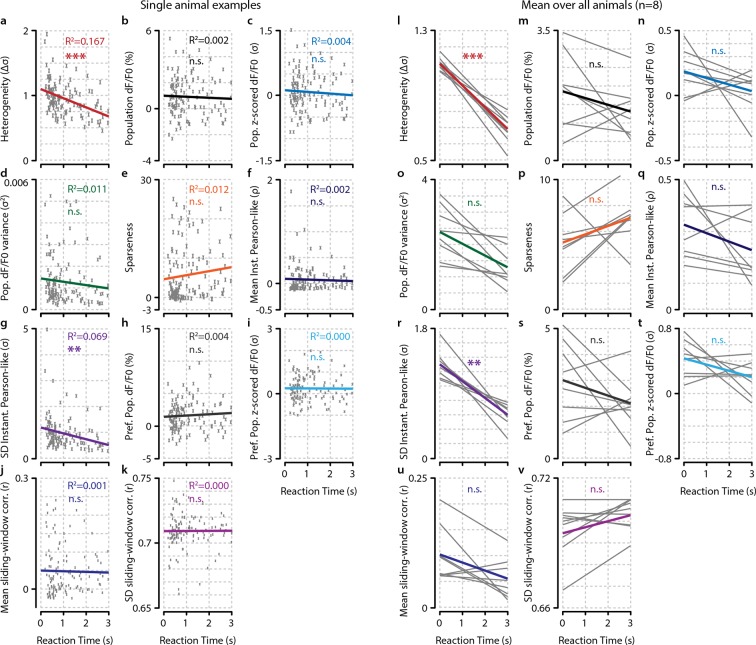
Figure 4—figure supplement 1. Of several tested neural metrics, only heterogeneity and spread (SD) in instantaneous Pearson’s correlations show a significant relationship with behavioral reaction time (RT).

Figure 4—figure supplement 1.

(a–k) RT relationship of several metrics for example single animal. Each gray point represents a single trial. (a) Heterogeneity plotted as a function of RT (Bonferroni–Holmes corrected regression slope vs. 0, p<0.001). (b) population dF/F0 (n.s.). (c) z-scored dF/F0 (n.s.). (d) variance (n.s.). (e) population sparseness (kurtosis) (n.s.). (f) mean instantaneous Pearson’s correlation (n.s.). (g) spread (SD) in instantaneous Pearson’s correlation (p<0.01). (h) Mean dF/F0 of preferred population (pref. pop.) (n.s.).(i) Mean z-scored dF/F0 of preferred population (P.P.) (n.s.). (j) mean of sliding window correlations (n.s.). (k) Spread (SD) of sliding window correlations (n.s.). (l–v) As (a–k) but for analysis across animals. Each gray line represents the linear regression of a single animal. Nongray lines represent the mean linear regression over all animals. Statistical significance of behavioral reaction time relationship was determined using Bonferroni–Holmes corrected one-sample t-tests of the slopes of all animals versus 0. Heterogeneity (p<0.001) and spread in instantaneous Pearson’s correlation (p<0.01) were significant; all other metrics were not (p>0.3). All panels: shaded areas show the standard error of the mean. Asterisks indicate statistical significance: *p<0.05; **p<0.01; ***p<0.001.
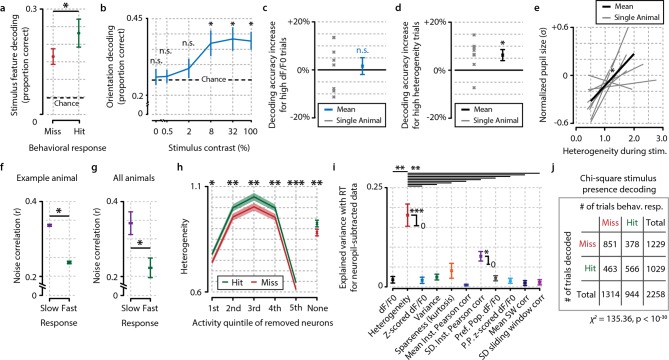
Figure 4—figure supplement 2. Fidelity of stimulus feature representation and population heterogeneity are correlated with accurate visual detection and are not influenced by neuropil contamination.

Figure 4—figure supplement 2.

(a) Analysis with a maximum-likelihood-naive Bayes decoder shows that during hit trials stimulus features (orientation and contrast) are more accurately represented in the population response pattern than during miss trials (paired t-test, n=8 animals, p<0.05). (b) Orientation decoding as a function of stimulus contrast shows a sigmoid curve. Statistical analysis revealed significantly above-chance orientation decoding for contrasts higher than 2% [post hoc FDR-corrected one-sample t-tests vs. chance level (25%; four orientations were used); 0%, p=0.724; 0.5%, p=0.721; 2%, p=0.410; 8%, p<0.05; 32%, p<0.05, 100%, p<0.05]. (c, d) Orientation decoding accuracy does not increase when only strong responses to stimuli are taken into account (c, one-sample t-test, p=0.669) but does increase for high population heterogeneity (d) (p<0.05). (e) Mean pupil size 1 s preceding stimulus onset is correlated with neuronal population heterogeneity during stimulus presentation, suggesting pre-stimulus arousal is related to heterogeneity (regression analysis per animal, one-sample t-test of slopes vs. 0, p<0.05, n=8 animals). (f) Comparison of noise correlations (NCs) during slow and fast behavioral response trials for an example animal shows a significant reduction in NCs when the animal responds fast (two-sample t-test, p<0.05, n=2211 pairs). (g) Analysis across animals shows that this reduction is consistent (p<0.05, n=8 animals). (h) Difference in heterogeneity between hit and miss trials is a population-distributed process and does not critically depend on selecting the most, or least, active neurons. On a single-trial basis, we removed a single quintile of neurons within a z-scored activity bracket and recalculated the hit/miss difference after removal of this quintile (see ‘Materials and methods’). While removal of the least (1st quintile) or most (5th quintile) active neurons per trial led to a decrease in absolute heterogeneity, the differences between hit and miss trials remained intact (paired t-tests hit vs. miss, n=8, 1st quintile p<0.05, 2nd p<0.005, 3rd <0.005, 4th p<0.005, 5th p<0.001, no removal, p<0.005). Data show mean and standard error over animals (n=8). (i) As Figure 4c, but when computed for neuropil-subtracted data (see ‘Materials and methods’). Explained variance values were quite similar for most measures and the difference between heterogeneity and the other metrics appeared larger than without neuropil subtraction. All panels: error bars and shaded areas indicate the standard error of the mean. Asterisks indicate statistical significance: *p<0.05; **p<0.005; ***p<0.001. (j) Chi-square analysis of stimulus presence decoding versus behavioral response show a strong correspondence at single-trial level between the decoder’s output and the animal’s response (p<10–30).