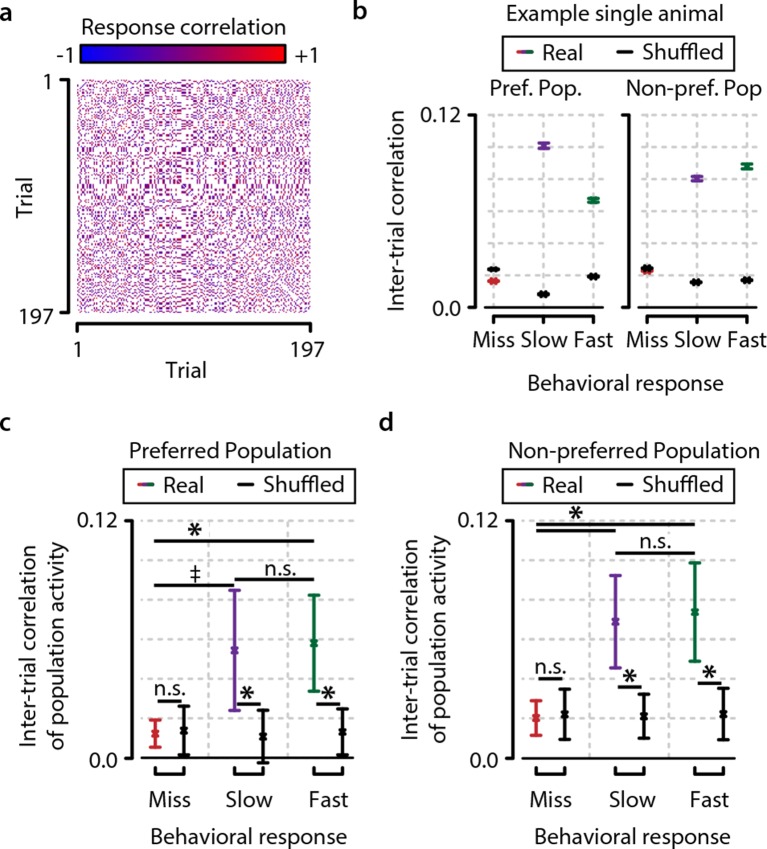
Figure 6. Consistency in population activation patterns across trials is increased during hit trials (fast and slow) compared to miss trials.
(a) Data from example animal showing inter-trial correlations (Pearson’s r) between population responses to same-orientation stimuli (pooled over test contrasts only). (b) Data from same animal as in panel (a), showing population higher activity pattern consistency (mean ± standard error over trial pairs) for fast and slow response trials than miss trials within both the preferred and nonpreferred population. Colored lines show real data, and black lines show shuffled data (see text and ‘Materials and methods’). (c, d) Inter-trial correlations (mean ± standard error over all animals) as quantification of population activation pattern consistency are significantly higher during fast trials (with a trend for slow trials) than during miss trials within the preferred as well as the nonpreferred neuronal population, suggesting that visual stimulus detection is correlated with the occurrence of more stereotyped population responses (FDR-corrected paired t-tests, preferred population; miss-slow, p=0.081; miss-fast, p<0.05; slow-fast, n.s.; nonpreferred population; miss-slow, p<0.05; miss-fast, p<0.05; slow-fast, n.s.). Comparison with correlations of shuffled data yielded similar results (both preferred and nonpreferred populations; paired t-test real vs. shuffled: miss; p>0.2, slow and fast; p<0.05). Error bars indicate standard error. Statistical significance: * p<0.05; ‡ 0.05<p<0.1.

