
Figure 3.
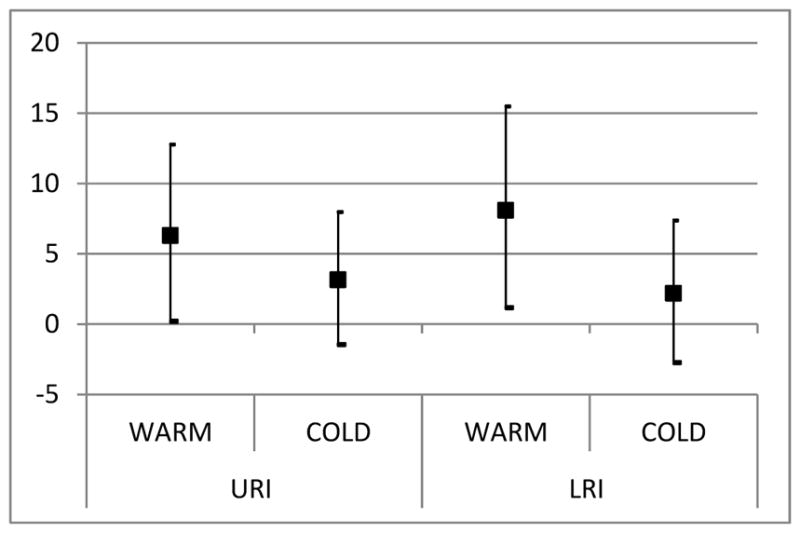
Percent increase in admissions for upper and lower respiratory infections for a 10°C increase in DTR by seasons. (Model adjusted for same day RH and PM, for all age groups)
Official websites use .gov
A
.gov website belongs to an official
government organization in the United States.
Secure .gov websites use HTTPS
A lock (
) or https:// means you've safely
connected to the .gov website. Share sensitive
information only on official, secure websites.
Percent increase in admissions for upper and lower respiratory infections for a 10°C increase in DTR by seasons. (Model adjusted for same day RH and PM, for all age groups)