
Figure 1.
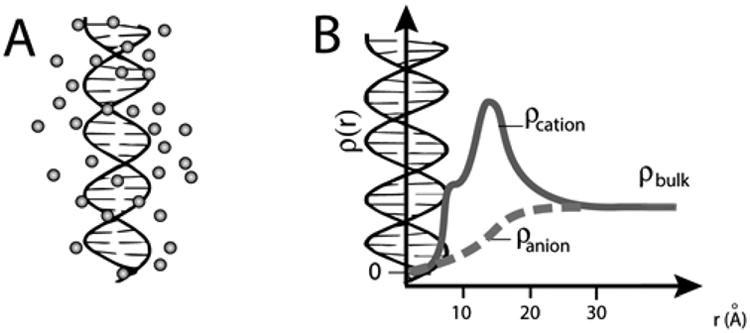
Nucleic acid ion atmosphere. (A) Schematic representation of the cation excess surrounding a nucleic acid. (B) Schematic representation of ion concentrations as a function of distance from a nucleic acid estimated by Poisson–Boltzmann (PB) theory; PB predictions adapted from ref 31. The cation concentration is the highest near to the nucleic acid and equal to the bulk concentration far from the nucleic acid; the anion concentration is lower near the nucleic acid relative to the bulk concentration. The number of ions associated with the ion atmosphere is calculated by integrating the excess ion density around the nucleic acid; eq 2).