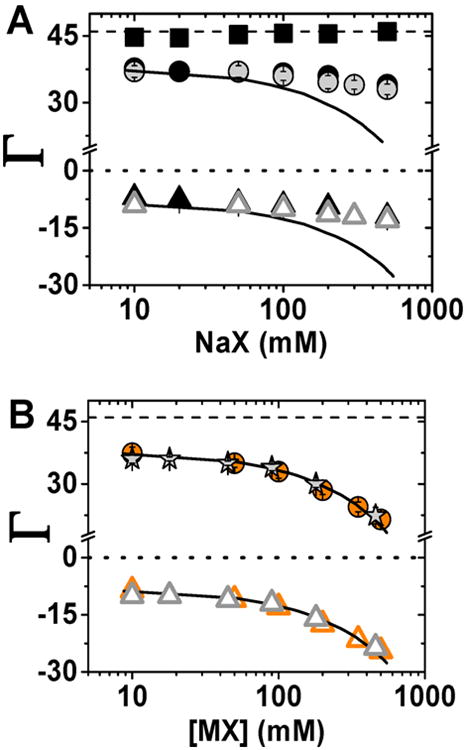
Figure 10.

Comparison between the experimentally determined ion preferential interaction coefficients (Γ) and theoretical estimate of these counts from PB model. (A) Comparison between experimental Γ for NaF (gray ●) and NaO2As(CH3)2 (Na+ (black ●), As(CH3)2O2− (black▲), and total ionic charge (black ■)) and PB predictions (solid black line). (B) Comparison between experimental Γ for NaI (orange ●) and CsF (gray stars) and PB predictions (solid black line). In both plots open triangles represent anion counts that were estimated on the basis of charge neutrality (eq 1). Error bars as in Figure 3.
