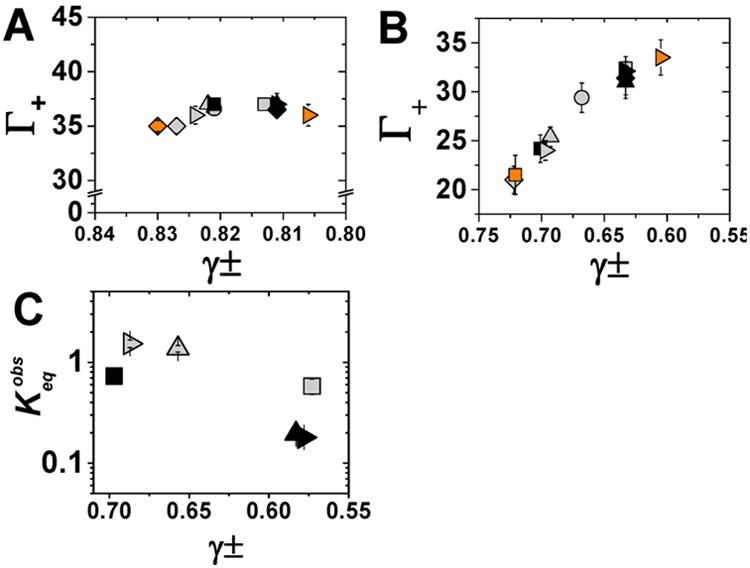
Figure 8.

Dependence of ion preferential interaction coefficients for 24bp and RNA folding on the mean activity coefficient of a series of electrolyte solutions.87 The number of associated cations as a function of mean activity coefficients at 50 mM (A) and 500 mM (B) bulk ion concentration. NaX salts are represented in gray, RbX salts in black and CsX salts in orange. Salts with the same anion are represented by common symbol: NaF, RbF, and CsF (■: gray, black, and orange, respectively); NaCl, RbCl (▲: gray and black, respectively); NaBr, RbBr, and CsBr (▶: gray, black, and orange, respectively), NaI and RbI (◆: gray and black, respectively). Note the different x-axis scales in (A) and (B). (C) Equilibrium constant of P4–P6 folding at 1 M NaX (gray) or RbX (black) with the following symbols for anions F− (■), Cl − (▲), and Br− (▶) as a function of mean activity coefficients for the given salt. Error bars correspond to the bootstrap-estimated 95% confidence intervals (SD = 2σ bootstrap).
