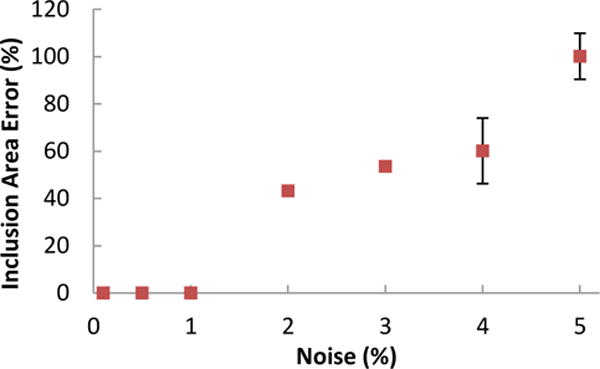
Fig. 6.

Effect of noise on identification of an inclusion. As the noise level increased, the size of the partition associated with the inclusion increased as well. There was no error in the calculation for noise levels of 1% or less. Each point is the average ± standard deviation of ten replications.
