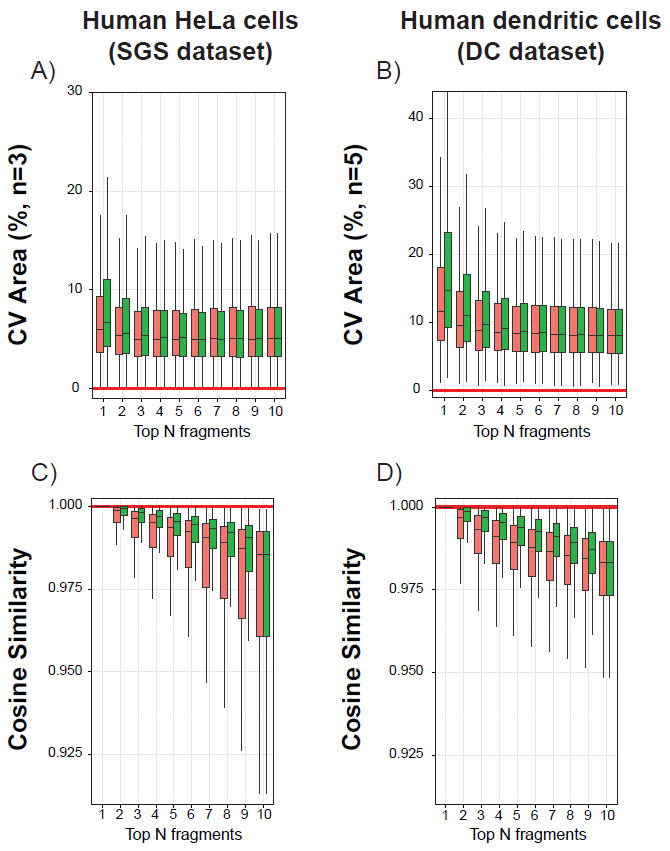
Figure 4.

Box-plots illustrating the distributions of the coefficient of variation (CV) of the normalized summed areas among experimental replicates (top panels A and B), as well as the distributions of cosine similarity between SWATH and DDA library intensity vectors (bottom panels C and D). Results were calculated with the library intensity (red) or the NOFI ranking method (green) from the SGS dataset 182 selected peptides spiked in human HeLa cell lysate digests (A and C) and from the 2284 DC dataset peptides (B and D). Solid horizontal red lines indicate best case values. Similar trends were observed for the SGS dataset results corresponding to water and yeast cells (data not shown).
