
Figure 5.
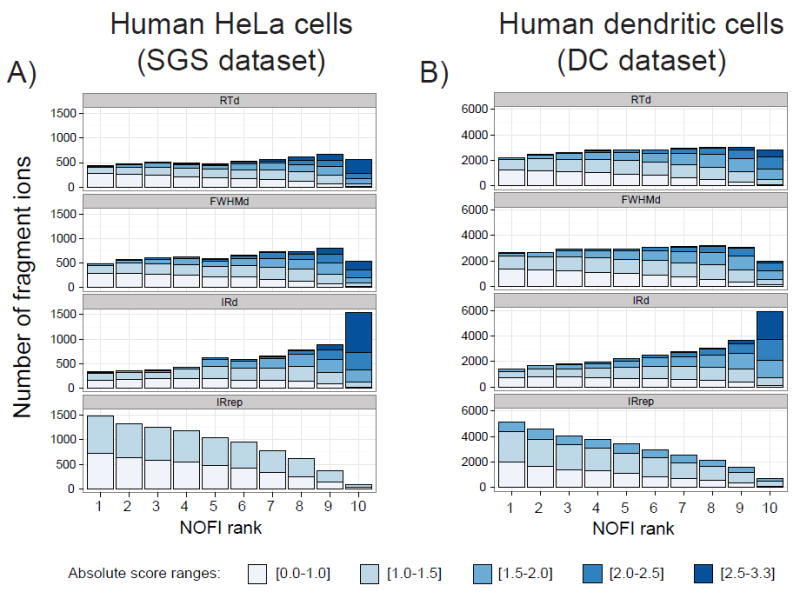
Bar charts illustrating the impact of each attribute used in the NOFI ranking algorithm when selecting only the attribute with the highest score for each fragment ion. The different datasets are: 182 SGS peptides spiked in human HeLa cell lysate digests (A) and 2284 DC native peptides from human dendritic cell lysate digests (B). The color intensity scale corresponds to five absolute score ranges, darker blue being the range with a higher likelihood of outlier detection. Similar trends were observed for the SGS dataset results corresponding to water and yeast cells (data not shown).