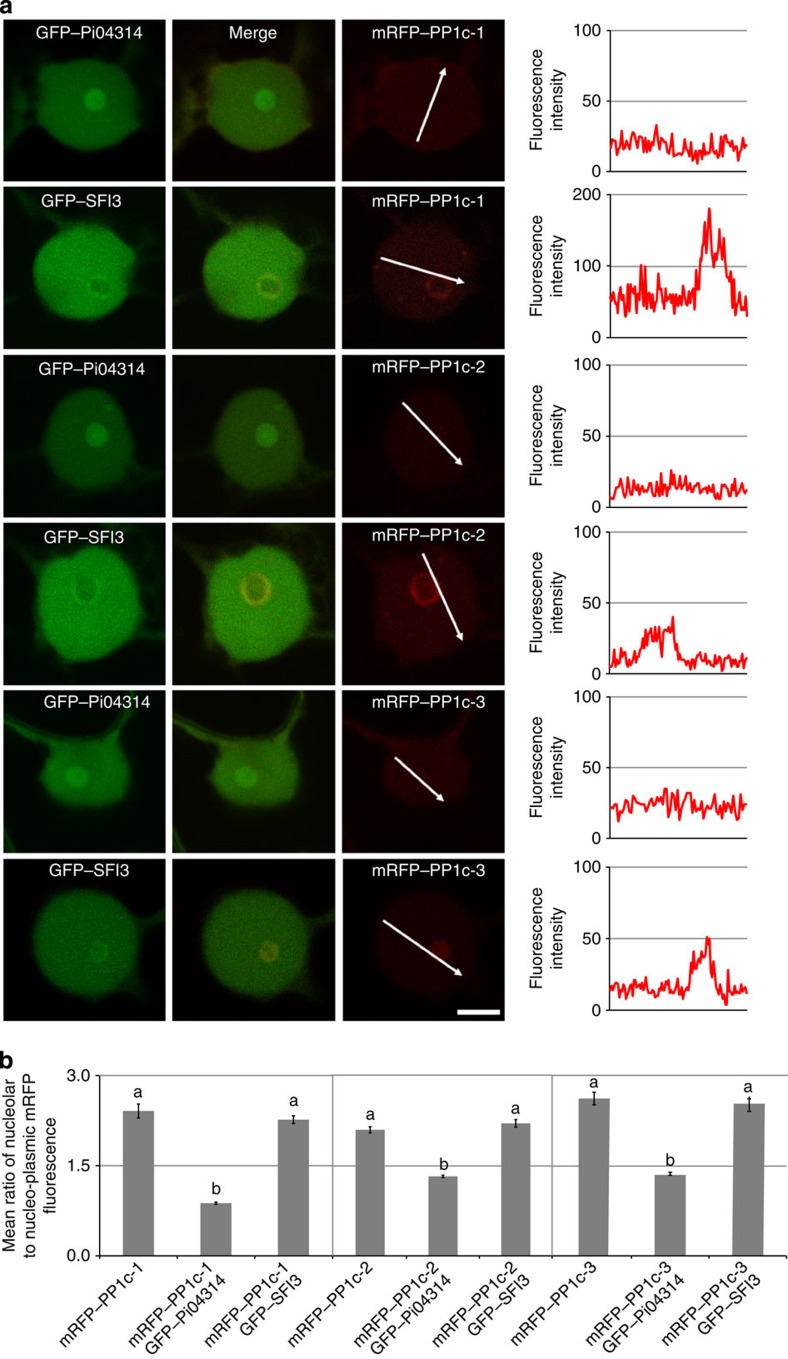
Figure 3. Co-expression of Pi04314 with the PP1c results in reduced nucleolar association of the latter.
(a) Image sets are single optical sections of typical nuclei co-expressing GFP–Pi04314 or the GFP–SFI3 control with each isoform of PP1c fused to mRFP. Scale bar, 5 μm. White arrows indicate mRFP fluorescence intensity plots shown in graphs to the right of each image. (b) Graphs of the average ratios of nucleolar to nucleoplasmic mRFP fluorescence from the PP1c isoforms alone or co-expressed with each effector, demonstrating that significant loss of mRFP–PP1c from the nucleolus occurred only in the presence of GFP–Pi04314. The averages were obtained from images of more than 50 nuclei for each condition. Error bars are s.e. and the graph represents the combined data from six biological replicates. Letters on the graphs denote statistically significant differences (ANOVA, P<0.001).

