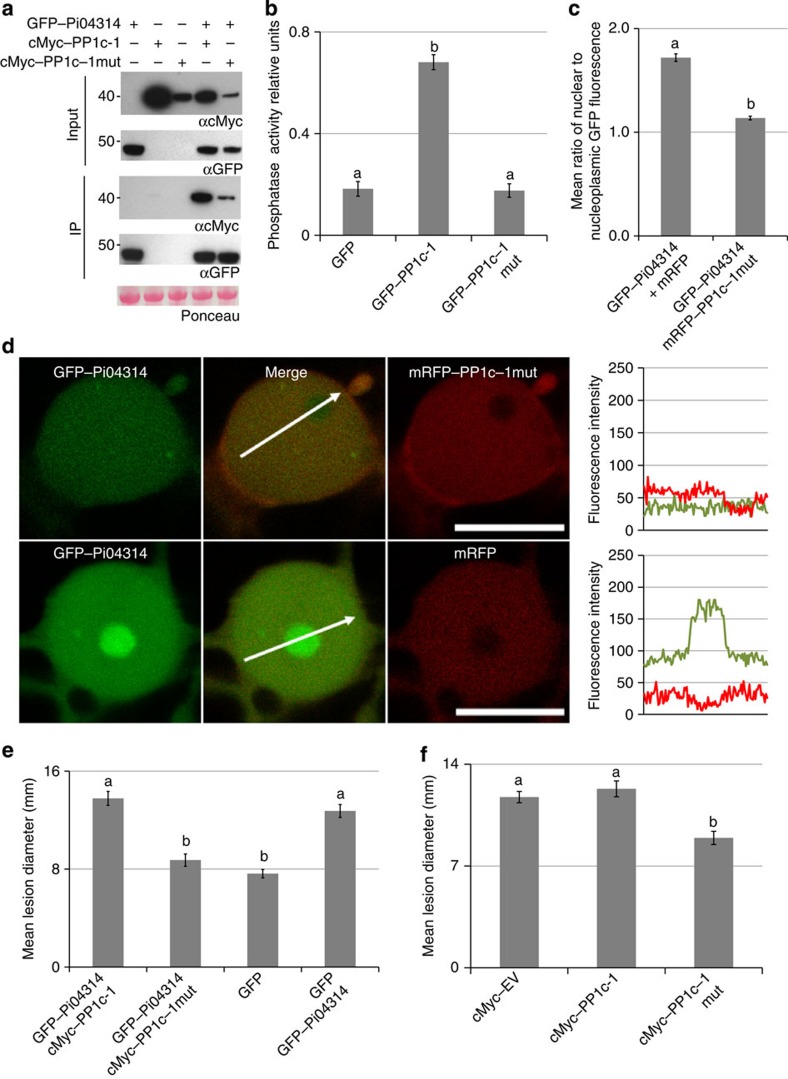
Figure 8. A phosphatase-dead mutant of PP1c-1 reduced P. infestans leaf colonization, and the enhanced colonization promoted by expression of the effector.
(a) Immunoprecipitation of protein extracts from agroinfiltrated leaves using GFP–Trap. Expression of constructs in the leaves is indicated by +. Protein size markers are indicated in kDa, and protein loading is indicated by Ponceau stain. Antibodies used are as indicated (αcMyc and αGFP). (b) Graph of the phosphatase activity of the wild-type GFP–PP1c-1 and mutated GFP–PP1c–1mut showing that the mutant showed similar background activity to the GFP empty vector control. Error bars are s.e. and the graph represents the combined data from three biological replicates. Letters on the graph denote statistically significant differences (ANOVA, P<0.001). (c) Graph of the average ratio of nucleolar to nucleoplasmic GFP fluorescence from the GFP–Pi04314 fusion protein expressed with mRFP–PP1c–1mut or, as a control, free mRFP. Error bars are s.e. and the graph represents the combined data from three biological replicates (n=40 per construct). Letters on the graph denote statistically significant differences (ANOVA, P<0.001). (d) Single optical section through co-expressing nuclei show that the effector fusion GFP–Pi04314 was reduced in the nucleolus when co-expressed with mRFP–PP1c–1mut, but not with free mRFP. Scale bar, 10 μm. White arrows indicate mRFP fluorescence intensity plots shown in graphs to the right of each image. (e) Co-expression of the cMyc–PP1c-1 wild-type did not significantly change the enhancement of P. infestans growth caused by expression of the GFP–Pi04314 effector compared with the control. However, co-expression of the mutant cMyc–PP1c–1mut with GFP–Pi04314 caused a significant reduction in effector-induced enhancement of colonization. Error bars are s.e. and the graph represents the combined data from three biological replicates (n=102 per construct). Letters on the graph denote statistically significant differences (ANOVA, P<0.001). (f) Expression of wild-type cMyc–PP1c-1 did not significantly alter P. infestans infection compared with the control empty (cMyc) vector (EV), but expression of the phosphatase-dead mutant cMyc–PP1c–1mut significantly reduced lesion growth. Error bars are s.e. and the graph represents the combined data from three biological replicates (n=73 per construct). Letters on the graph denote statistically significant differences (ANOVA, P<0.001).

