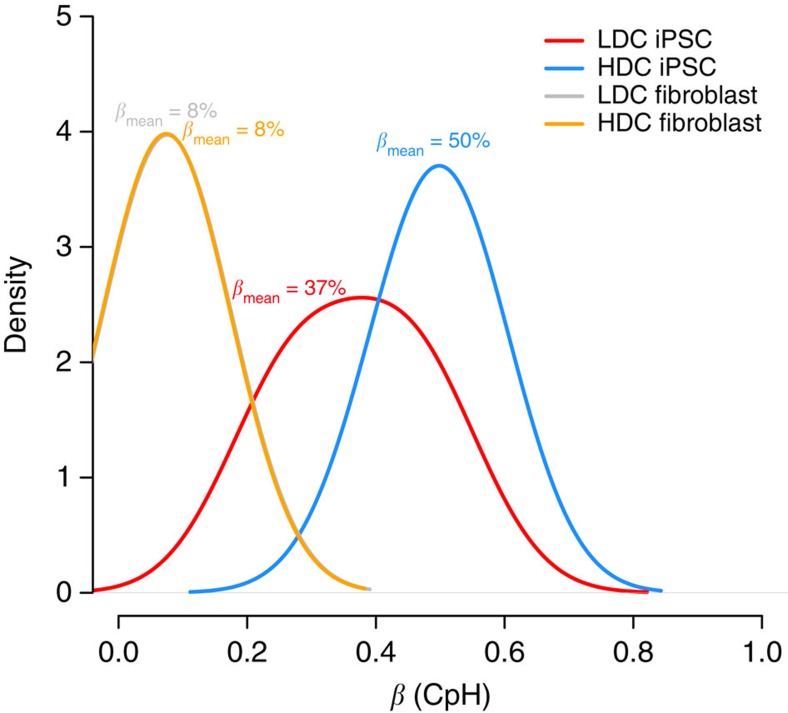
Figure 1. Non-CG methylation is prevalent but reduced in LDC hiPSCs.
Density plot illustrating the difference in non-CG methylation profiles between low-differentiation capacity (LDC; red line) and high-differentiation capacity (HDC; blue line) hiPSCs. The difference in mean methylation (Δβ) was large (13%) and significant (P<7.4 × 10⁻⁴). For comparison, non-CG profiles are plotted for donor cell lines giving rise to LDC (grey line) and HDC (orange line) hiPSCs; the difference between these donor cell lines was not significant.

